Cards
All the insights in Aruba Central (on-premises) display certain cards with additional information specific to that insight. The top view of each card usually shows the top 5 data in a pie chart or a bar graph view. For few cards there is further drill down available in form of a drop-down list. The cards might vary for each insight based on the context the insight is accessed from.
The following table displays the cards available in different insights:
|
Cards |
Card Details |
Description |
|---|---|---|
|
|
|
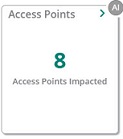
The card displays the number of APs impacted by an Insight. Click the arrow |
|
|
|
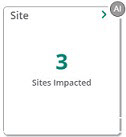
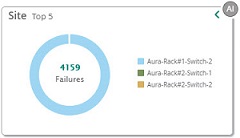
The card displays the number of sites impacted by an Insight. Click the arrow |
|
|
|
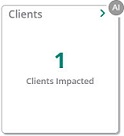
The card displays the number of clients impacted by an insight. Click the arrow |
|
|
|
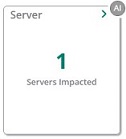
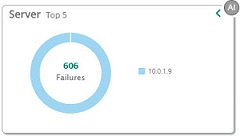
The card displays the number of servers impacted by an insight. Click the arrow |
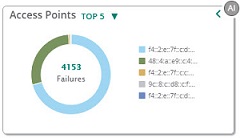
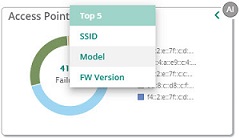
 to expand the card and view the top 5 APs where the issue occurred. You can also click the drop-down list to view further details about the impacted access points.