
Failed Wireless Client Events or Reasons
The page provides a summary view of all the clients connected to the network. You can filter clients based on the network the clients are connected to. The page displays key client information and also allows you to view a specific client detail page.
By default, the page displays a unified list of clients for the selected group. The list of clients is populated for a time range of 3 hours. To view the list of clients for a different time range, click the link and select the required time period. Total data usage for the selected time period is displayed above the client summary bar.
To filter clients based on the device to which the clients are connected, select the device type from the drop-down list:
- —Displays a unified list of clients connected to the network.
- —Displays a list of clients connected to the Instant AP.
- —Displays a list of clients connected to the switch.
- —Displays a list of clients connected to the Aruba Controller.
The wired client will show up in the page only if the client is connected to an Aruba 2540 Series, Aruba 2920 Series, Aruba 2930F Series, Aruba 2930M Series, Aruba 3810 Series, or Aruba 5400R Series switch.
To view failed clients and the reason for their failure, complete the following steps:
- In the app, use the filter bar to select a group, label, site, or a device.
- Under , click . The All Clients overview page is displayed.
- Click from the clients summary bar to view a list of all the failed clients.
- Hover over the status of a particular client to view the following information. This information is provided by the AI Insights feature based on algorithms and smart analytics:
- - Date and time at which the client was last seen
- - Failure status of the client that failed to connect. The failure reasons could be:
- Association error
- MACMedia Access Control. A MAC address is a unique identifier assigned to network interfaces for communications on a network. authentication error
- 802.1X802.1X is an IEEE standard for port-based network access control designed to enhance 802.11 WLAN security. 802.1X provides an authentication framework that allows a user to be authenticated by a central authority. authentication error
- Key exchange error
- DHCPDynamic Host Configuration Protocol. A network protocol that enables a server to automatically assign an IP address to an IP-enabled device from a defined range of numbers configured for a given network. error
- Captive PortalA captive portal is a web page that allows the users to authenticate and sign in before connecting to a public-access network. Captive portals are typically used by business centers, airports, hotel lobbies, coffee shops, and other venues that offer free Wi-Fi hotspots for the guest users. error
- - Based on the failure stage, failure reason is populated. For example, if it is a 802.1X authentication error, the reason for the failure could be .
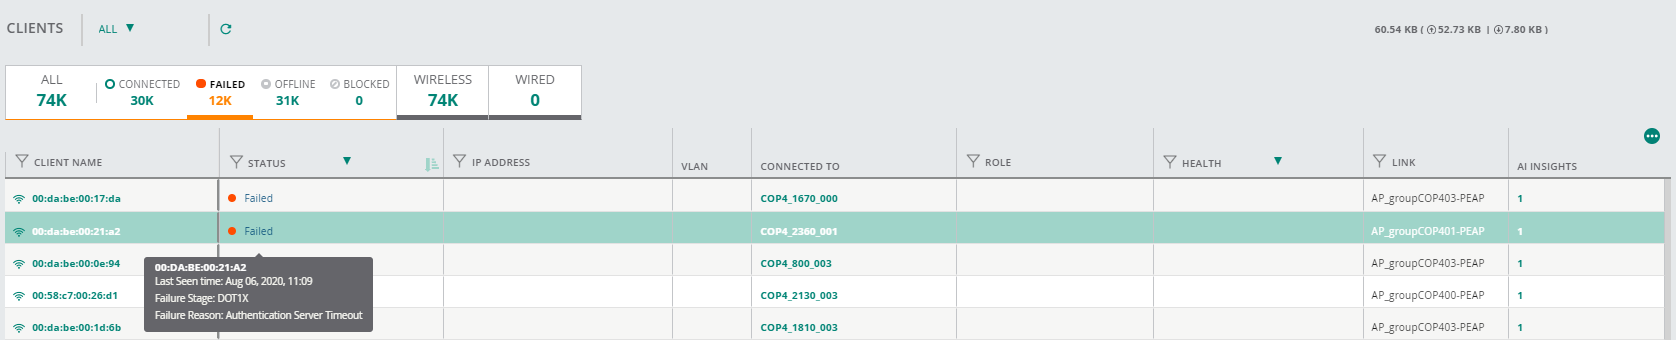
- You can also view if any AI Insight is associated with the failed client by clicking on the number under the AI Insights column. This will lead to Insights page.
