
Monitoring Sites in the Topology Tab
In Aruba Central (on-premises), the tab in the site dashboard provides a graphical representation of the site including the network layout, and details of the devices deployed, and the health of the WANWide Area Network. WAN is a telecommunications network or computer network that extends over a large geographical distance. uplinks and tunnels.
In Aruba Central (on-premises), the Topology tab does not support Campus controllers and Campus APsCampus APs are used in private networks where APs connect over private links (LAN, WLAN, WAN or MPLS) and terminate directly on controllers. Campus APs are deployed as part of the indoor campus solution in enterprise office buildings, warehouses, hospitals, universities, and so on..
The Topology feature is available for Foundation and Advanced licenses for APs, switches, and gateways.
This section includes the following topics:
Before You Begin
The following types of devices are displayed as part of the tab:
- Access Point (AP)
- Switch—AOS-Switch, AOS-CX switch
- Stack—AOS-Switch stack, AOS-CX VSF stack
- AOS-CX VSX Switch
In the topology map, Aruba Central (on-premises) only supports third-party routers, switches, and APs from the vendors listed below:
- Cisco
- Procurve
- Juniper
- HPE Comware
- Meraki
- Cumulus
- Huawei
- Mikrotik
- Extreme
- HPE OfficeConnect Switch
- Arista
- 3Com
- Ruckus
- Mojo
- Mist
- Motorola
- Netgear
- Dell
- Comware
- Hirschmann Railswitch
- Ubiquiti
This section discusses the pre-requisites associated with the devices so that they are displayed correctly in the tab:
- The topology map filters devices based on sites. To view the topology map, ensure that you have assigned the devices to sites.
- The minimum required Aruba OS version for access points (APs) in the topology map is Aruba OS version 8.1.0.0-1.0.1.1.
- To view AOS-CX switches in the topology map, you must create a template configuration for the switch with the password in plaintext.
Viewing the Topology Tab
To view the topology tab, complete the following steps:
- In the app, set the filter to a site for which you want to view the topology map.
The dashboard context for the site is displayed.
- Under , click > .
The Topology map for the selected site is displayed.
- In the topology map, hover over a device or a link to view the pop-up details. For more information, see Pop-Up Details.
- In the device or the link pop-up, click the link to view the corresponding pane. For more information, see Details Pane .
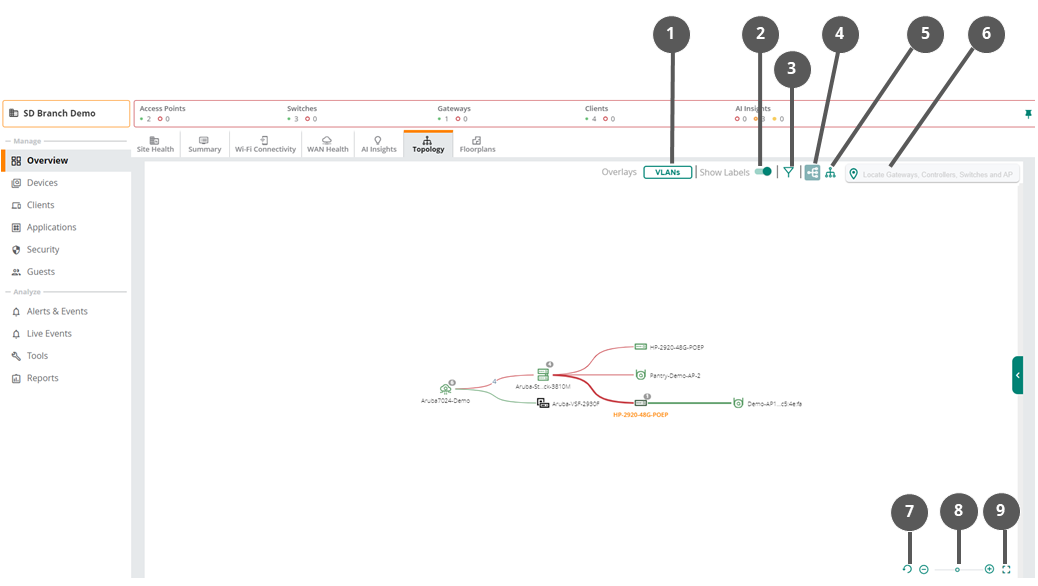
Parts of the Topology Tab User Interface
In the topology tab, the icons provides the following functionality:
Figure 1 Parts of the Topology Tab
|
Callout Number |
Description |
|---|---|
|
1 |
Click the icon to show or hide the pane. |
|
2 |
Set the toggle icon to show or hide the labels. |
|
3 |
Click the icon to filter the type of devices to be shown on the map. The following options are available:
|
|
4 |
Click the icon to view the topology map in a left to right orientation. The default orientation of the topology map is left to right orientation. |
|
5 |
Click the icon to view the topology map in a top to down orientation. |
|
6 |
The search bar allows you to locate a device in the topology map. The search bar field supports exact and partial text search. |
|
7 |
Click the icon to reset the topology map to the default view. |
|
8 |
Click the icons to change the zoom level of the topology map. Alternatively, you can drag the slider to set the zoom level of the topology map. |
|
9 |
Click the icon to view the topology map in full-screen view. In the full-screen view, the pop-up details feature is disabled in the topology map. |
When the number of downstream devices connected to a device is less than or equal to 10, the devices are visible in the topology map. When the number of downstream devices connected to a device is more than 10, click the device icon to view the devices in the topology map. A bubble icon on the device represents the number of connected downstream devices.
|
Icon |
Type |
|---|---|
|
|
AP |
|
|
Switch |
|
|
Switch Stack |
|
|
Unmanaged Device |


Icon Status
-
 —Indicates that the device health is poor when the CPUCentral Processing Unit. A CPU is an electronic circuitry in a computer for processing instructions. usage is greater than 90% and the memory usage is greater than 90%.
 -
 —Indicates that the device health is good when the CPU usage is lower than or equal to 75% and the memory usage is lower than or equal to 75%.
 -
 —Indicates that the device health is fair when the CPU usage is greater than 75% and the memory usage is greater than 75%.
 -
 —Indicates that the device is online.
 -
 —Indicates that the device is offline.
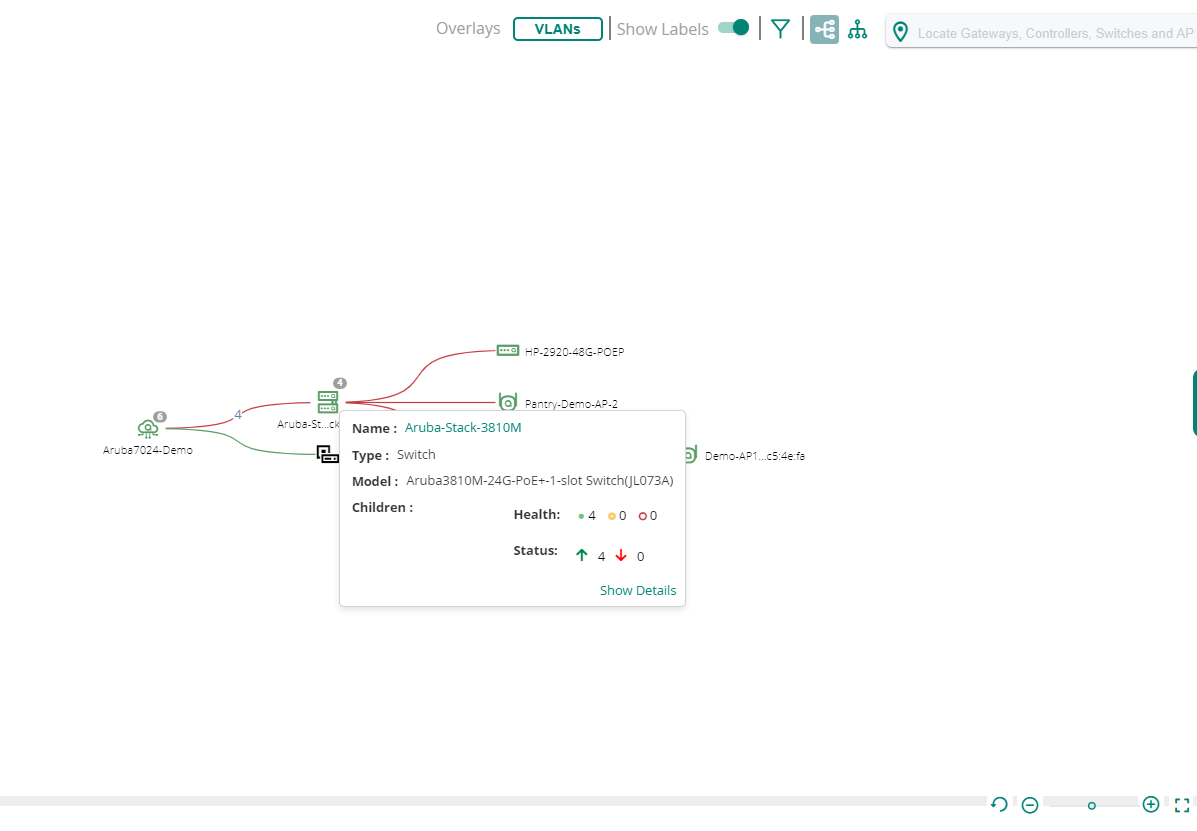
Pop-Up Details
When you hover over a device or link, a pop-up displays the following details:
Figure 2 Pop-Up Details
|
Type |
Description |
|---|---|
|
Access Point |
Displays the following details:
|
|
Unmanaged |
Displays the following details:
The value of the parameter is empty if LLDPLink Layer Discovery Protocol. LLDP is a vendor-neutral link layer protocol in the Internet Protocol suite used by network devices for advertising their identity, capabilities, and neighbors on an IEEE 802 local area network, which is principally a wired Ethernet. does not provide the neighbor information. |
|
Switch |
Displays the following details:
|
|
Switch Stack |
Displays the following details:
|
|
AOS-CX VSX Switch |
Displays the following details:
|
|
Edge |
Displays the following information about the edge link:
The edge in green color indicates that the edge is up. The edge in red color indicates that the edge is down. Click the edge link to view the pane. |
|
Unmanaged edge |
Displays the following information about the link:
The unmanaged edge in green color indicates that the unmanaged edge is up. The unmanaged edge in red color indicates that the unmanaged edge is down. Click the unmanaged edge link to view the pane. |
|
ISL edge in AOS-CX VSX toplogy map |
Displays the following information about the link:
|
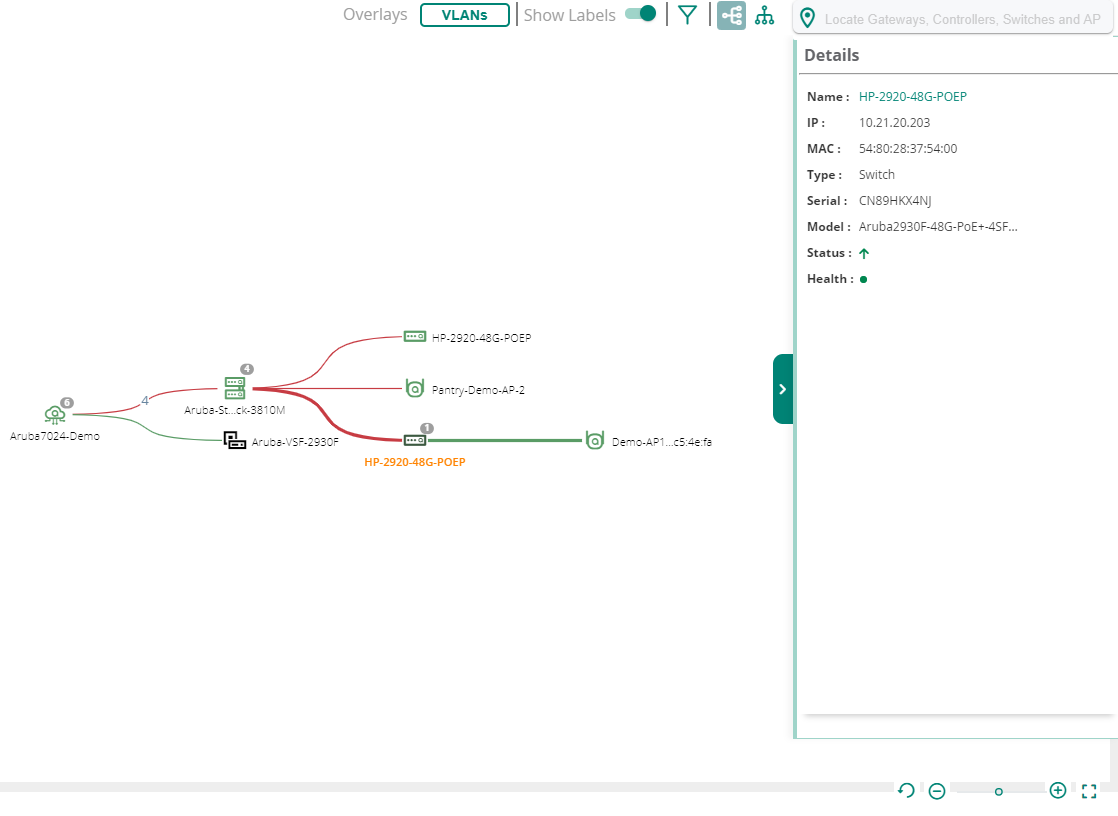
Details Pane
In the topology map, the pane provides a summary of the devices, uplinks, and tunnel details.
A green bullet icon indicates that the device health is good when the CPU usage is lower than or equal to 75% and the memory usage is lower than or equal to 75%. A yellow bullet icon indicates that the device health is fair when the CPU usage is greater than 75% and the memory usage is greater than 75%. A red bullet icon indicates that the device health is poor when the CPU usage is greater than 90% and the memory usage is greater than 90%. The arrow in green indicates that the device is online. The arrow in red indicates that the device is offline.
In the topology map, select a device and then click the link in the pop-up window to view the pane. To view the pane for a tunnel, uplink, or edge, click the link.
The task pane displays the following information:
Figure 3 Details Pane
|
Type |
Description |
|---|---|
|
Access Point |
Displays the following details:
|
|
Unmanaged |
Displays the following details:
The value of the parameters are empty if LLDP does not provide the neighbor information. |
|
Switch |
Displays the following details:
|
|
Switch Stack |
Displays the following details:
|
|
AOS-CX VSX |
Displays the following details:
section displays the following details:
|
|
Edge |
Displays the following information about the link:
|
|
Unmanaged edge |
Displays the following information about all the links:
|
|
ISL edge in AOS-CX VSX toplogy map |
Displays the following information about the ISL edge:
|
Unreachable Devices
The pane provides information about the orphan and the offline unmanaged devices. An unmanaged device is considered to be orphan when all its neighboring Aruba devices get deleted and are only displayed in the list. An unmanaged device is considered to be offline when all its neighboring Aruba devices are offline and are displayed both in the map and in the list.
When an unmanaged device is either offline or disconnected, they are only displayed in the list. The devices listed in the pane are deleted after 15 days.
To view the pane, click the button. The pane displays the following details:
- —Name of the unmanaged device.
- —Type of the unreachable device.
- —MAC address of the unmanaged device.
- —The last active time and date of the unmanaged device.
VLAN Overlay Details
The topology map displays information about the VLANs configured on switches running AOS-Switch and AOS-CX software. To view the VLAN information:
- Select the VLANs option under Overlays. The VLANs pane is displayed and the network elements in the topology map, such as device icons and edge links, are grayed out.
The pane displays the first 50 VLANs (unique VLAN ID and name pairs) in the ascending order of VLAN IDs. To search for other VLANs, click the search icon.
- Select a VLAN from the VLANs pane. You can also enter a VLAN name or ID in the search box.
- The topology map displays the following information:
- The switches that have the selected VLANs configured are highlighted in a color depending on the status of the switch, green for online and red for offline.
- The edge link connecting two switches is highlighted in blue, if the following conditions are met:
- The VLAN IDs are present in both the switches and in the ports associated with the edge link between the switches.
- The VLAN type (tagged or untagged) configured is the same in both the switches.
- Hover over the switch to view the list of all VLANs (comma separated) configured on the switch.
The VLAN IDs are also listed as a range if consecutive VLAN IDs are configured. For example, 100-178, 190, 210.
- Hover over the edge link connecting the two switches. The pop-up displays the following information:
- Host name of the switch
- Serial number of the switch
- VLAN ID
- Type of VLAN: tagged, untagged, or missing
