Monitoring UCC in List View
The page displays graph and table view to assess the quality of calls in the network. You can view data for the level.
- For the Application Layer Gateway (ALGApplication Layer Gateway. ALG is a security component that manages application layer protocols such as SIP, FTP and so on. ) like Skype SDNSoftware-Defined Networking. SDN is an umbrella term encompassing several kinds of network technology aimed at making the network as agile and flexible as the virtualized server and storage infrastructure of the modern data center., the end-to-end Mean Opinion Score (MOS) is used. A good call has a MOS of more than 3.5, a fair call has a MOS in the range of 2.0 to 3.5, a poor call has a MOS of less than 2.0, and an unknown call does not have a MOS.
- Wi-FiWi-Fi is a technology that allows electronic devices to connect to a WLAN network, mainly using the 2.4 GHz and 5 GHz radio bands. Wi-Fi can apply to products that use any 802.11 standard. Calling calls are not assigned an UCCUnified Communications and Collaboration. UCC is a term used to describe the integration of various communications methods with collaboration tools such as virtual whiteboards, real-time audio and video conferencing, and enhanced call control capabilities. RTPA score (RTPReal-Time Transport Protocol. RTP is a network protocol used for delivering audio and video over IP networks. analysis) and are categorized as unknown.
List view
The view in the page provides a lists to assess the quality of calls in the network.
Time Filter
The ![]() time filter allows you to set a time range to display the corresponding data on the graph. You can set the filter to
any of the following time ranges:
time filter allows you to set a time range to display the corresponding data on the graph. You can set the filter to
any of the following time ranges:
- —The graph displays the details for the past three hours.
- —The graph displays the details for the current day.
- —The graph displays the details for the current week.
- —The graph displays the details for the current month.
Calls List
The list displays the following details:
| Parameter | Description |
|---|---|
|
Displays the Call Detail Record (CDR). The value displayed in the column indicates the number of calls for the corresponding client. The |
|
|
Start Time |
Displays the date and time when the call was started. |
|
Client Name |
Displays the name of the client. |
|
Call Quality |
Displays the quality of the call. You can filter the data by:
|
|
Client Health |
Displays the client health score. |
|
Displays the SSID. |
|
|
Protocol Type |
Displays the type of protocol. You can filter the data by:
|
|
Session Type |
Displays the type of session. You can filter the data by:
|
|
OS |
Displays the operating system running on the client. |
|
User Role |
Displays the user role that initiated the call. |
|
Call Duration |
Displays the duration of the call. |
|
Client IP Address |
Displays the IP address of the client. |
|
Peer IP Address |
Displays the peer IP address of the client. |
|
AP Host Name |
Displays the host name of the AP. |
|
AP type |
Displays the type of AP. |
|
Displays the BSSID of the client. |
|
|
Displays the DSCP of the client. |
|
|
Quality Score |
Displays the quality score of the call. |
|
Source Port |
Displays the source port number. |
|
Destination Port |
Displays the destination port number. |
|
Displays the priority value for Wifi Multimedia (WMM). |
|
|
Codec |
Displays the Codec name. |
|
From |
Displays the device originating the call. |
|
To |
Displays the device receiving the call. |
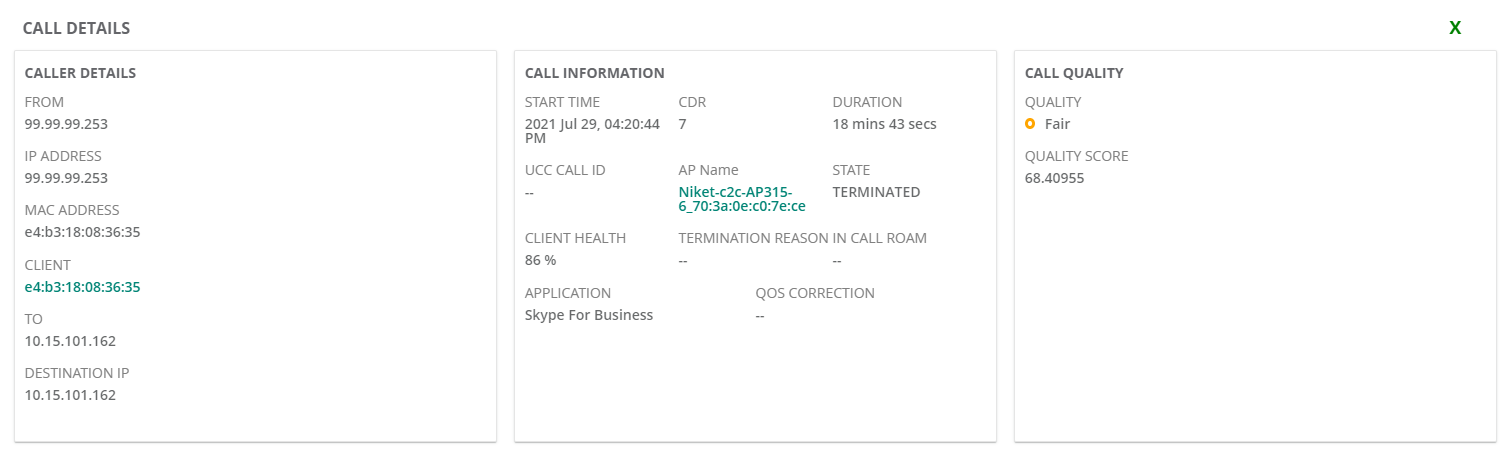
Call Details
The following image shows the Call Details window that is displayed when you click the value in the CDR column.