
Client Events
Aruba Central (on-premises) allows you to troubleshoot issues related to a wired or wireless clients connected to APs. The Events tab at the client context provides a capability to filter events further to identity a specific issue and troubleshoot it. It provides an aggregate view of events based on its severity level categorized under Negative, Positive, or Neutral
Events
To access the client event information connected to an IAP, complete the following steps:
- In the app, set the filter to one of the options under , , or . For all devices, set the filter to .
The dashboard context for the selected filter is displayed. - Under , click . The clients overview page is displayed in view.
- By default, the table displays a unified list of clients.
- Click the name of the wireless or wired client to open the corresponding page. If there are many clients connected to the network, click or .
- Enter the client name in the column, and click the client name.
- Under , click .
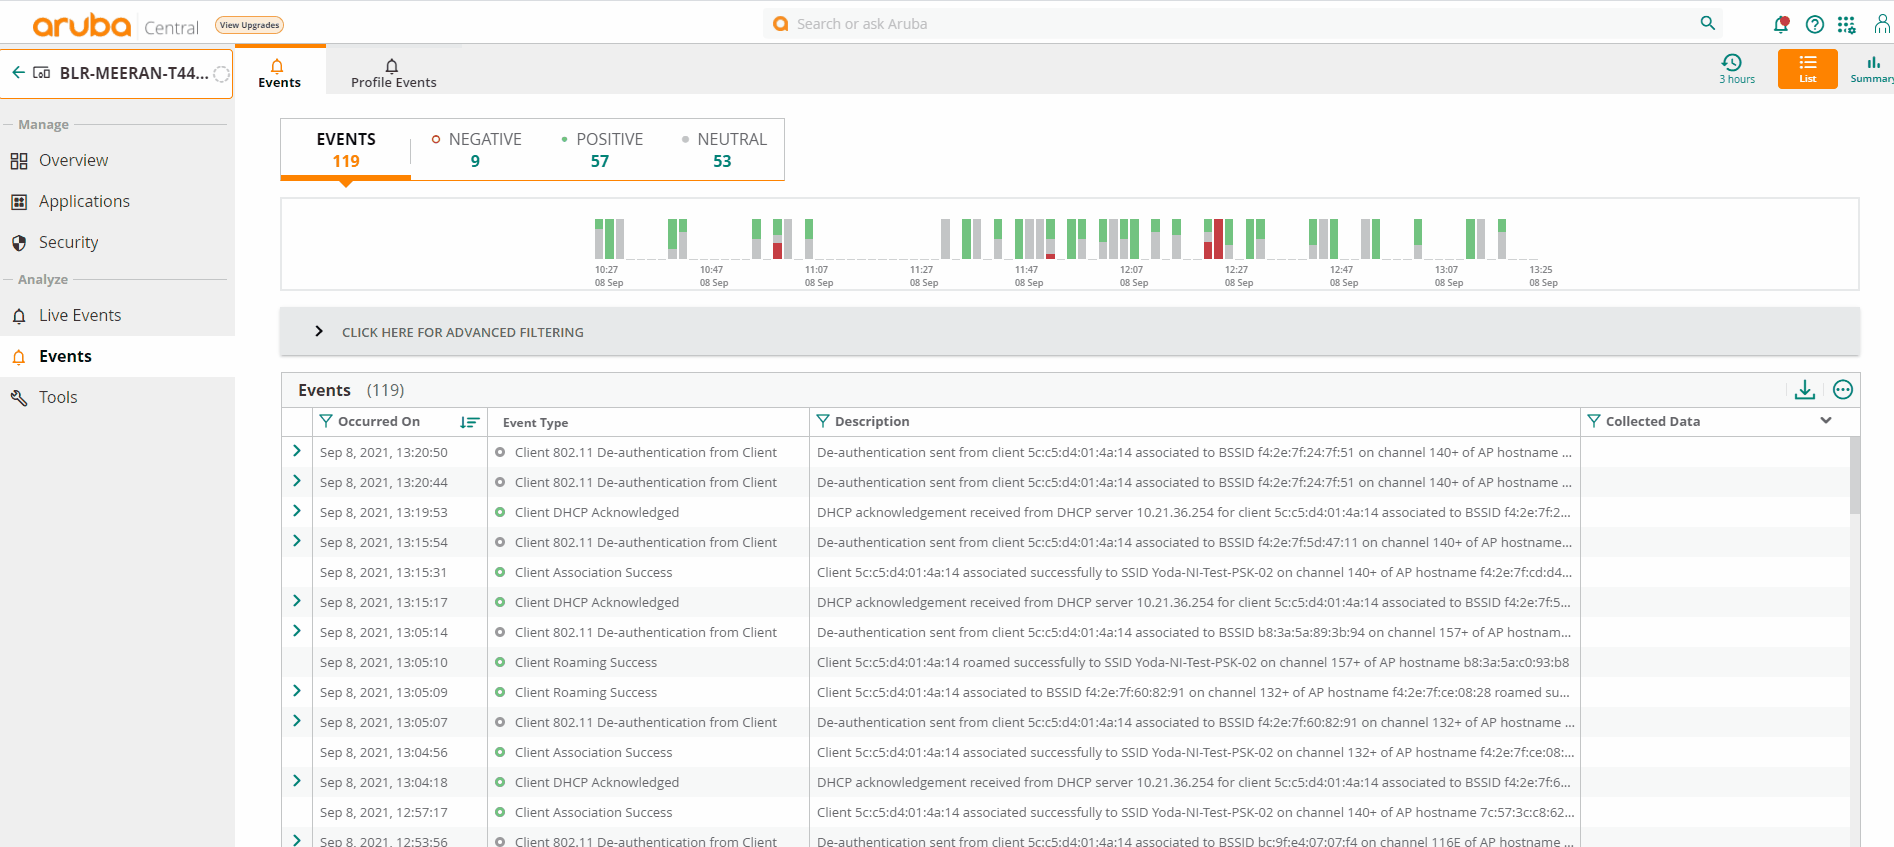
By default the Events tab is selected and the Events table is displayed with the list of events specific to the selected client. The Events tab categorizes the events as Negative, Positive, or Neutral.
Filtering Events in the List View
Aruba Central allows you to filter the events based on the event types. Perform the following steps to filter events based on event types in the List view:
- In the page, click to filter the events based on event types.
- Select the event type and click . You can select multiple event types from the advanced filtering option.
- The events table displays the list of events generated in each event type. The filter summary bar displays the total number of events in the selected category and the type(s) of events.
- Optionally, to clear advanced filtering option, from the events summary bar, click .
The following table describes the information displayed in each column of the table:
|
Data Pane Content |
Description |
|
|
Displays the timestamp of the event. Use the sort option to sort the events by date and time. Use the filter option to select a specific time range to display the events. |
|
|
Displays the host name of the device where the event is generated. Use the filter option to filter events by hostname. |
|
|
Displays the MACMedia Access Control. A MAC address is a unique identifier assigned to network interfaces for communications on a network. address of the device. Use the filter option to filter events by device MAC address. |
|
|
Displays the BSSIDBasic Service Set Identifier. The BSSID identifies a particular BSS within an area. In infrastructure BSS networks, the BSSID is the MAC address of the AP. In independent BSS or ad hoc networks, the BSSID is generated randomly. of the device. Use the filter option to filter events by the BSSID. |
|
|
Displays the type of the event along with the severity level represented by an icon for each event type. |
|
|
Displays the description of the event. Use the column filter to perform a free search and filter an event based on the description. You can type a search phrase including client MAC, reason code, or BSSID and filter the events. |
The event columns allows free text search at all column levels to enhance filtration.
Additionally, it displays an event frequency bar which shows the time range of the events that occurred. This allows you to view the actual time of the failure, which helps in troubleshooting the issue. Drag and select a specific range to filter events occurred in that time range. Hover over each bar to see the proportion of negative, positive and neutral events distributed in a specific time range. The distribution changes based on the time range selected in the Time Range Filter (![]() ).
).
To clear any time range selected on the frequency bar, click .
Filtering Events in the Summary View
Aruba Central allows you view different event types for the selected client distributed across the time line. You can filter the events based on the event types and drill down further to diagnose client's health. It gives a deep insight on the failure events that occur in the network.
Select the Summary view icon to display the list of events. The graphs in the view displays the events in the following categories:
- Events by severity—Displays the event severity categorized under Negative, Positive, or Neutral. Click each tab to drill down to each category. The frequency bar and the event type chart changes accordingly and displays events based on the selected tab.
- Events Frequency Bar—Displays the time range of the events that occurred. This allows you to view the actual time of the failure, which helps in troubleshooting the issue. Drag and select a specific range to filter events occurred in that time range. Hover over each bar to see the proportion of negative, positive and neutral events distributed in a specific time range. The distribution changes based on the time range selected in the Time Range Filter (
 ). To clear any time range selected on the frequency bar, click .
- Events Frequency Bar—Displays the time range of the events that occurred. This allows you to view the actual time of the failure, which helps in troubleshooting the issue. Drag and select a specific range to filter events occurred in that time range. Hover over each bar to see the proportion of negative, positive and neutral events distributed in a specific time range. The distribution changes based on the time range selected in the Time Range Filter (
- Events per type—Displays the different event types categorized based on severity and color codes as following:
- Red—Indicates negative severity
- Green—Indicates positive severity
- Grey—Indicates neutral severity
This Events per type section has the following capabilities:
- Click on the event type to open a new pane which displays details regarding that event type. It shows the time range when the specific event occurred, the APs that were impacted, and a pictorial pie chart of the reason codes for that failure event. Hover your mouse to see the different reason codes differentiated with color codes. Clicking on the reason codes redirects you to the events list with appropriate reason selected.
The new pane provides advanced links to troubleshoot at the device level:
- Click on the AP name or the bar to navigate to the AP details page for that particular event. On the AP details page, you can click the Events tab to see the event details.
- Click on the number displayed against each bar to navigate to AP events page along with the filter for the selected client and the event type. The number displayed against each bar is the frequency of the selected event occurred on that particular AP.
- Click on the number displayed against each event type bar to go back to the event list view for that particular event. You can see the list of all the events with details within the selected time range. In this case all the details is pre-selected for the user.
The components of the Events summary page is displayed for a selected time period based on the time selected in the Time Range Filter (![]() ). You can select one of the following: , , , or .
). You can select one of the following: , , , or .
