Floorplans Dashboard
The dashboard can be accessed from a site context, or an access point context. You can either navigate to a specific site to view the floor plan, or view a specific site floor plan from the tab in the context.
To view the dashboard from the tab in the context, complete the following steps:
1. In the app, set the filter to .
The dashboard context for the filter is displayed.
2. Under > , click . The page is displayed.
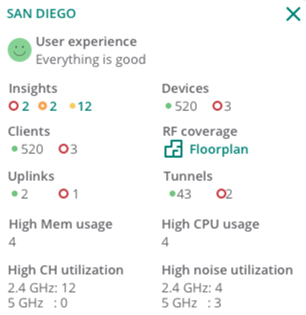
3. Hover over a site to view the following details:
4. Click under . The dashboard for the selected site is displayed.
To view the dashboard from a site context, complete the following steps:
1. In the app, set the filter to a .
The dashboard context for the selected site is displayed.
2. Under > , click . The dashboard is displayed.
The dashboard allows you to customize the view by selecting various properties and also allows you to select multiple floors in the same site.
To view the dashboard from an access point context, complete the following steps:
1. In the app, set the filter to .
The dashboard context for the filter is displayed.
2. Under > , click .
A list of access points is displayed in the view.
3. Click the name to view the page. If there are many APs connected to the network, click to filter the online APs.
4. Additionally, enter the access point name in the column and then click the access point name. The page is displayed.
5. Under > , click . The floorplan details for the AP is displayed.
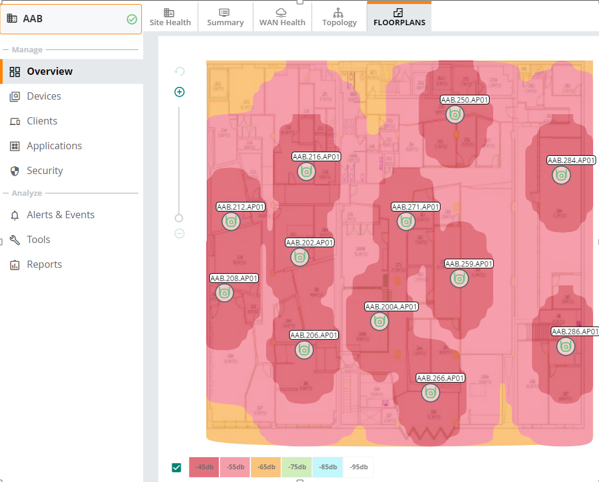
Customizing the Floorplans View
The dashboard provides various options to customize your view. The customizable parameters include:
—Click the drop-down to select a specific floor from the site.
—Click to view the details of the Instant AP and the RFRadio Frequency. RF refers to the electromagnetic wave frequencies within a range of 3 kHz to 300 GHz, including the frequencies used for communications or Radar signals. environment.
—Click to view the client details.
—Click to view the rogue details.
—Click to view the strength of RF coverage in each location. You can view heatmaps in monochrome also. Click the monochrome checkbox in the dashboard to select either the monochrome display or the coloured display of heatmaps.
—Click to view the segregation of regions and walls in the selected floor.
—Click the or icon to zoom in or zoom out of a floorplan. You can also scroll to increase or decrease the floorplan view. Additionally, click the box icon to view the floorplan in full screen mode.
—Click the refresh icon to refresh the floorplan details.
Figure 1 Floorplans Dashboard