
Monitoring Sites in the Topology Tab
In Aruba Central, the tab in the site dashboard provides a graphical representation of the site including the network layout, and details of the devices deployed, and the health of the WANWide Area Network. WAN is a telecommunications network or computer network that extends over a large geographical distance. uplinks and tunnels.
|
|
The minimum required ArubaOS version for topology is ArubaOS version 8.1.0.0-1.0.1.1. |
This section includes the following topics:
Parts of the Topology Tab User Interface
Before You Begin
The pre-requisite for Aruba CX switches is:
To view Aruba CX switches in the topology map, you must create a template configuration for the switch with the password in plaintext.
Viewing the Topology Tab
To view the topology tab, complete the following steps:
1. In the app, set the filter to one of the options under for which you want to view the topology map.
The dashboard context for the site is displayed.
2. Under , click > .
The tab for the selected site is displayed.
3. In the topology map, hover over a device or a link to view the pop-up details. For more information, see Pop-Up Details.
4. In the device or the link pop-up, click the link to view the corresponding pane. For more information, see Details Pane .
Parts of the Topology Tab User Interface
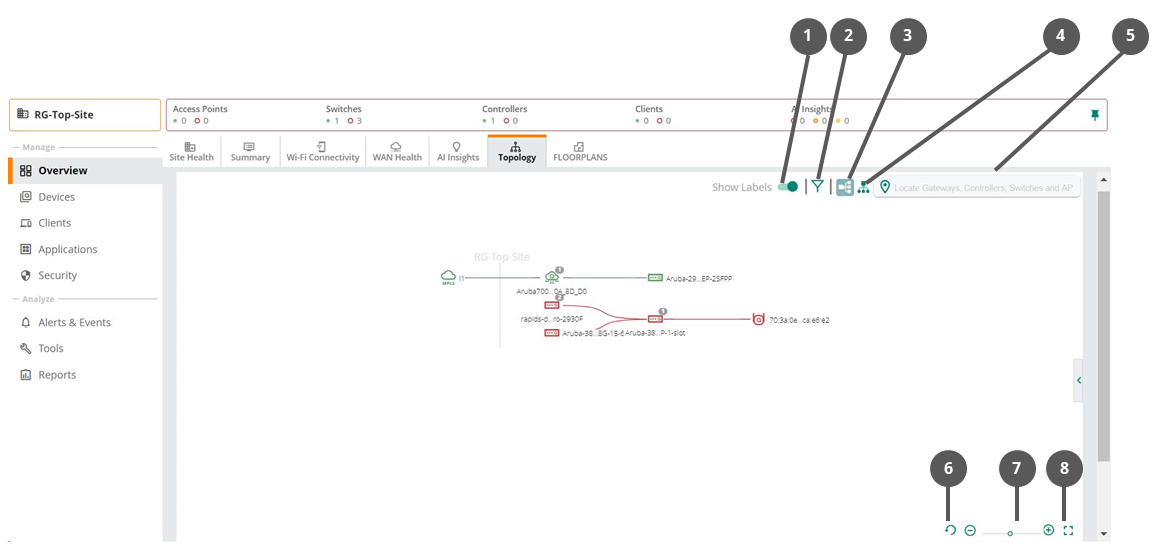
In the topology tab, the icons provides the following functionality:
Figure 1 Parts of the Topology Tab
|
Callout Number |
Description |
|---|---|
|
1 |
Set the toggle icon to show or hide the labels. |
|
2 |
Click the icon to filter the type of devices to be shown on the map. The following options are available: —Allows you to show or hide the access points from the topology map. —Allows you to show or hide the Zscaler and Palo Alto Prisma Access™ Cloud Service from the topology map. —Allows you to show or hide the switches from the topology map. —Allows you to show or hide the VPNCs and virtual gateways from the topology map. —Allows you to show or hide the devices without link from the topology map. |
|
3 |
Click the icon to view the topology map in a left to right orientation. The default orientation of the topology map is left to right orientation. |
|
4 |
Click the icon to view the topology map in a top to down orientation. |
|
5 |
The search bar allows you to locate a device in the topology map. The search bar field supports exact and partial text search. |
|
6 |
Click the icon to reset the topology map to the default view. |
|
7 |
Click the icons to change the zoom level of the topology map. Alternatively, you can drag the slider to set the zoom level of the topology map. |
|
8 |
Click the icon to view the topology map in full-screen view. In the full-screen view, the pop-up details feature is disabled in the topology map. |
|
|
When the number of downstream devices connected to a device is less than or equal to 10, the devices are visible in the topology map. When the number of downstream devices connected to a device is more than 10, click the device icon to view the devices in the topology map. A bubble icon on the device represents the number of connected downstream devices. |
Pop-Up Details
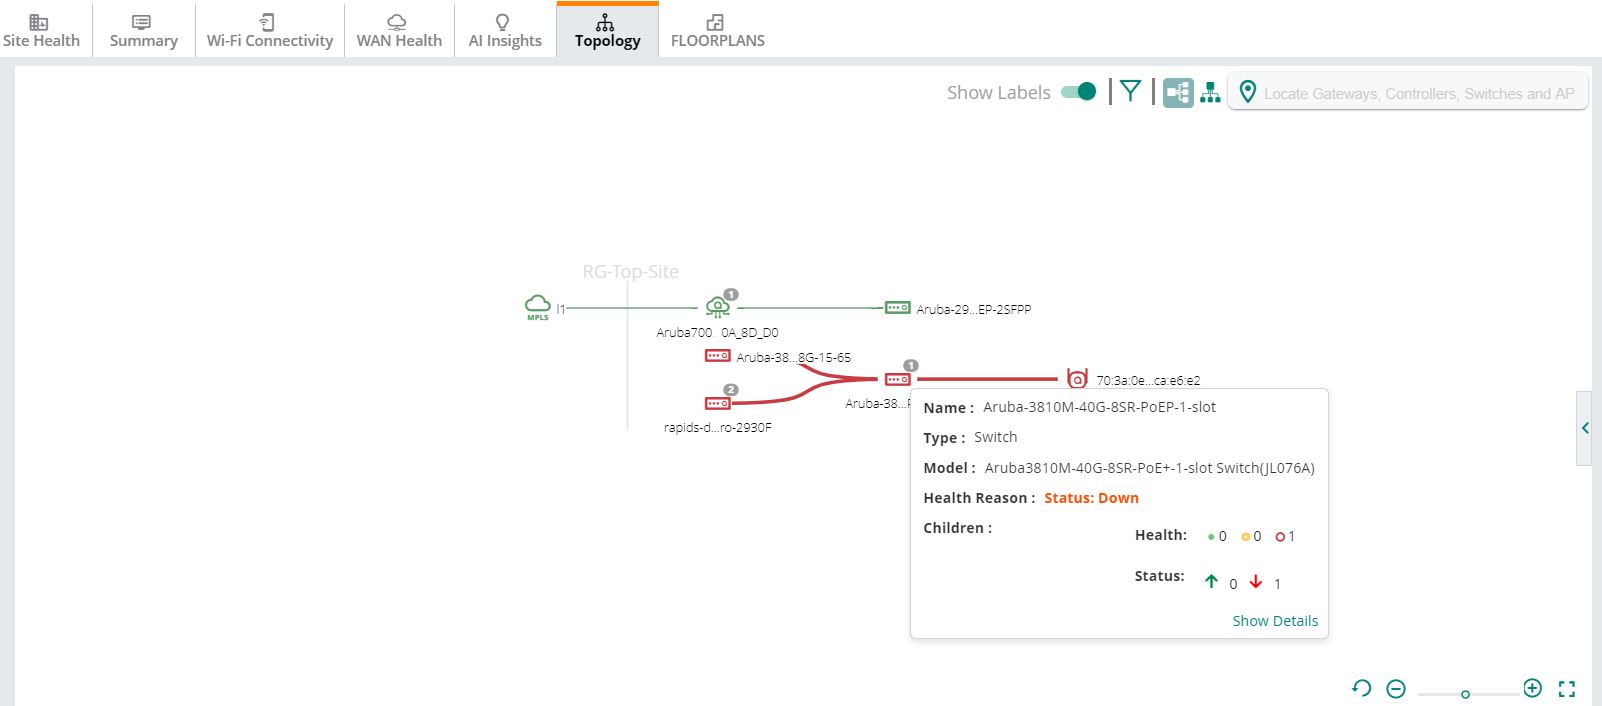
When you hover over a device or link, a pop-up displays the following details:
Figure 2 Pop-Up Details
|
Type |
Description |
|---|---|
|
Access Point |
Displays the following details: —Hostname of the access point. —Type of the device. —Hardware model of the access point. —The health status of the access point. This parameter is only available when the access point is offline. —Click the link to view the pane. |
|
Switch |
Displays the following details: —Hostname of the switch. —Type of the device. —Hardware model of the switch. —Number of devices connected to the switch categorized based on the health and status of the devices. The field displays the following details: —Count of devices connected to the switch based on the health of the device. The red, yellow, and green dots indicate the health of the devices. —Count of devices connected to the switch based on the current status of the devices. The green (up) and red (down) arrows indicate the status of the devices. —Click the link to view the pane. |
|
Switch Stack |
Displays the following details: —Hostname of the switch stack. —Type of the device. —Hardware model of the switch. —Number of devices connected to the switch categorized based on the health and status of the devices. The field displays the following details: —Count of devices connected to the switch based on the health of the device. The red, yellow, and green dots indicate the health of the devices. —Count of devices connected to the switch based on the current status of the devices. The green (up) and red (down) arrows indicate the status of the devices. —Click the link to view the pane. |
|
Aruba CX VSX Switch |
Displays the following details: —Name of the Aruba CX switch that is configured with VSX. The name is displayed in the format. For example, . —Type of the device. —Hardware model of the Aruba CX switch. —Role of the Aruba CX switch in the VSX configuration. Supported values are and . —Number of devices connected to the switch categorized based on the health and status of the devices. The field displays the following details: —Count of devices connected to the switch based on the health of the device. The red, yellow, and green dots indicate the health of the devices. —Count of devices connected to the switch based on the current status of the devices. The green (up) and red (down) arrows indicate the status of the devices. —Click the link to view the pane. |
|
Edge |
Displays the following information about the edge link: —Interface number of the device. —Displays the name of the device. —Displays the health status and reason of the down edge link. This parameter is only available when the edge link is down. The red and green color of the edge link indicates the health of the edge. Click the edge link to view the pane. |
|
ISL edge in Aruba CX VSX toplogy map |
Displays the following information about the link: —Number of inter-switch link (ISL) present between the Aruba CX switches configured with VSX. —Number of other links present between the Aruba CX switches configured with VSX. |
Details Pane
In the topology map, the task pane provides a summary of the devices, uplinks, and tunnel details. The red and green indicators show the current status and health of the WAN uplinks and tunnels.
In the topology map, select a device and then click the link in the pop-up window to view the pane. To view the pane for a tunnel, uplink, or edge, click the link.
Figure 3 Details Pane

The task pane displays the following information:
|
Type |
Description |
|---|---|
|
Access Point |
Displays the following details: —Hostname of the access point. Click the access point name to view the page. —IP address of the access point. —MACMedia Access Control. A MAC address is a unique identifier assigned to network interfaces for communications on a network. address of the access point. —Type of the device. —Serial number of the access point. —Hardware model of the access point. —Operational status of the access point. —Operational health of the access point. |
|
Switch |
Displays the following details: —Hostname of the switch. Click the switch name to view the page. —IP address of the switch. —MAC address of the switch. —Type of the device. —Serial number of the switch. —Hardware model of the switch. —Operational status of the switch. —Operational health of the switch. |
|
Switch Stack |
Displays the following details: —Hostname of the switch. Click the switch name to view the page. —IP address of the switch. —MAC address of the switch. —Type of the device. —Serial number of the switch. —Role of the switch in the stack. —Hardware model of the switch. —Operational status of the switch stack. —Operational health of the switch stack. —Provides the , , and details of the stack member. Click the stack member name to view the page. |
|
Aruba CX VSX |
Displays the following details: —Hostname of the Aruba CX switch with VSX configured. Click the switch name to view the page. —IP address of the switch. —MAC address of the switch. —Type of the device. —Serial number of the switch. —Hardware model of the switch. —Operational status of the switch. —Operational health of the switch.
section displays the following details: —State of the ISL connection with the peer Aruba CX switch. Following are the supported values: —Waiting for connectivity to the peer. —Steady state. VSX LAGs are up when the device is in this state. —Lost ISL connectivity to the peer and the device is operating as primary. —Lost ISL connectivity to the peer and the device is operating as secondary. —ISL connectivity to the peer restored and the device is syncing states to the peer. —ISL connectivity to the peer restored and he device is learning states from the peer. VSX LAGs are down when the device is in this state. —Device has learned its states from the peer and monitoring for hardware is to be programmed. VSX LAGs are down when the device is in this state. —ISL port number of the selected Aruba CX switch. If the ISL is a LAGLink Aggregation Group . A LAG combines a number of physical ports together to make a single high-bandwidth data path. LAGs can connect two switches to provide a higher-bandwidth connection to a public network. , then this field displays the LAG name. —Management state of the ISL. Following are the supported values: —ISL management is operational. INTER_SWITCH_LINK_MGMT_INIT—ISL management is in initialization state. CONFLICTING_OR_MISSING_DEVICE_ROLES—Either the role is missing on one of the VSX peers or the same role is configured on both VSX peers. SW_IMAGE_VERSION_MISMATCH_ERROR—Software version on the primary device does not match with the software version on the secondary device. INTER_SWITCH_LINK_DOWN—ISL is down. INTERNAL_ERROR—ISL management has internal errors. —Configuration synchronization between the VSX switches are enabled or disabled. —Status of the configuration synchronization between the VSX switches. Following are the supported values: IN-SYNC—Configuration synchronization is operational and the VSX switches are in sync. DISABLED—Configuration synchronization is disabled. SW_IMAGE_VERSION_MISMATCH_ERROR—Software image version on the primary device does not match with the software image version on the secondary device. CONFLICTING_OR_MISSING_DEVICE_ROLES—Either the role is missing on one of the VSX peers or the same role is configured on both VSX peers. PEER_DB_CONNECTION_ERROR—Error in connecting to peer database. It involves errors due to ISL or ISL management. CONFIGURATION_SYNC_CONFLICT—Configuration synchronization is operational, but has conflicts synchronizing the configuration. Conflicts can occur if the configuration on the primary device is marked for sync, but the same configuration on the secondary device is not marked for sync. CONFIGURATION_SYNC_MISSING_REFERENCE—Configuration synchronization is operational, but has missing references in synchronizing the configuration. —Role of the Aruba CX switch in the VSX configuration. Supported values are and . —IPv4 address of the peer switch. —Serial number of the peer switch. —MAC address of the peer switch. —Hostname of the peer switch. —Date on which the peer switch was last synced. |
|
Edge |
Displays the following information about the link: —Interface numbers of the device. —Interface number of the individual device. —Serial number of the individual device. —The name of the individual device. —The port number of the individual device. In case of Branch Office Controller (BOC) to Switch link, if a peer Branch Gateway link is configured for redundancy, link details are displayed for the peer Branch Gateway to switch link as well. |
|
ISL edge in Aruba CX VSX toplogy map |
Displays the following information about the ISL edge: —Status of the ISL connection with the peer. section displays details about all the interfaces that are part of the LAG. The section also displays the details of the devices connected to these interfaces. It displays the following details: —Serial number of the individual device. —Name of the individual device. —Port number of the individual device. —This section displays details about the other links present between the VSX configured Aruba CX switches. It displays the following details: —Serial number of the individual device. —Name of the individual device. —Port number of the individual device. |
