Monitoring Radios in Summary View
The tab in the access point (AP) Summary page displays the channel distribution, power distribution, channel changes, and power changes metrics for the radios provisioned and managed in Aruba Central (on-premises). When you click the tab, the and tabs are displayed.
Viewing the Radios Summary Page
To navigate to the Radios Summary page, complete the following steps:
- In the app, set the filter to one of the options under , , or . For all devices, set the filter to . Ensure that the filter selected contains at least one active AP.The dashboard context for the selected filter is displayed.
- Under , click > . A list of APs is displayed in the view.
- Click the icon.The AP Summary page is displayed.
-
Click the tab.
When you click the tab, it displays the following information:
- —Click the tab to display the graphs related to channel distribution and power distribution.
- —Click the tab to display the graphs related to channel distribution and power distribution for 2.4 GHzGigahertz. radios.
- —Click the tab to display the graphs related to channel distribution and power distribution for 5 GHz and 5 GHz (Secondary) radios.
The tri-radio feature is available only for AP-555. In the tab, the data is available only if the tri-radio mode is enabled. For more information, see About Tri-Radio Mode.
You can change the time range for the AP Summary page by clicking the time range filter and selecting one of the available options: , , , , and
When you click the , , and tab, the tab provides the following information:
Radios
The section displays the channel distribution and power distribution graphs for the radios.
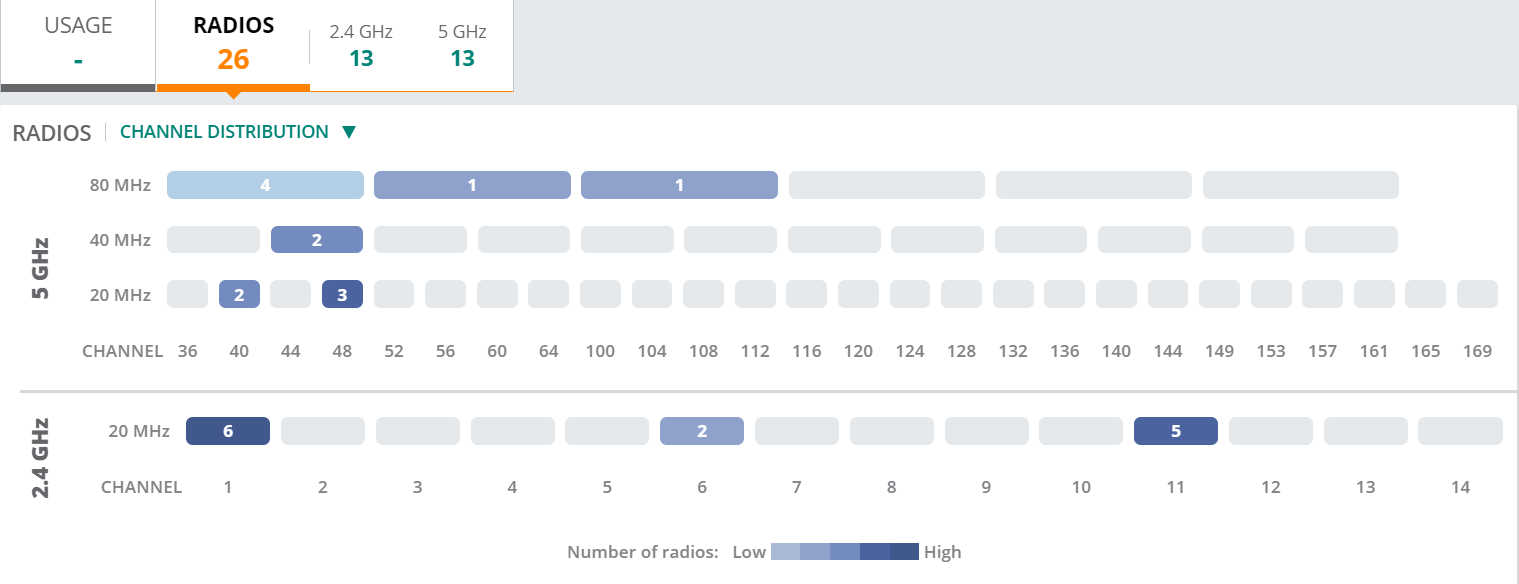
Channel Distribution
From the drop-down list, select to display information on the frequency, at which each of the channels of the radio operate.
Figure 1 Channel Distribution

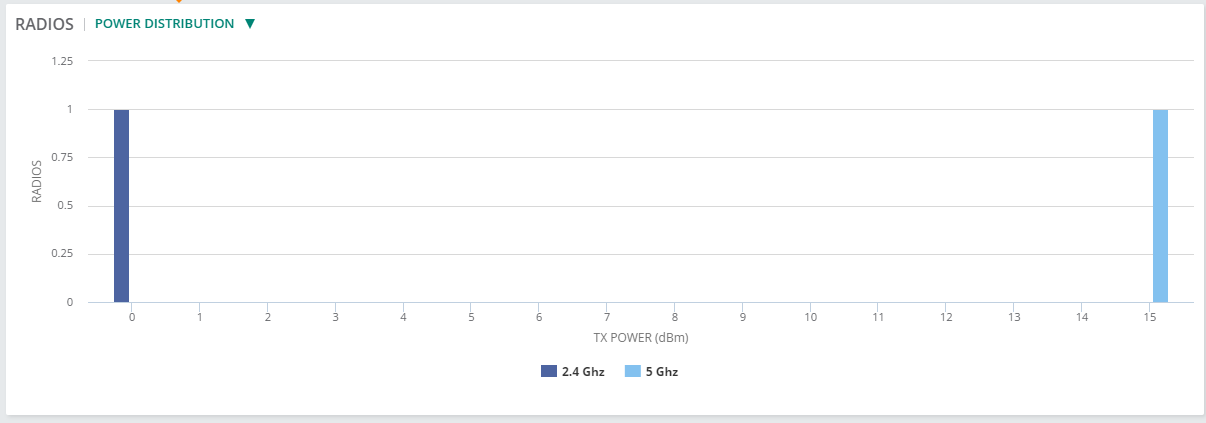
Power Distribution
From the drop-down list, select to display the power distributed across each of the radios.
Figure 2 Power Distribution

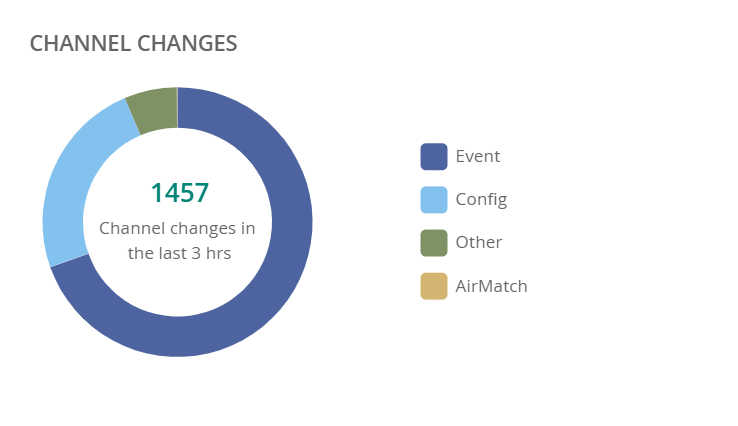
Channel Changes
The graph displays the number of channel changes that has occurred in the radios.
Figure 3 Channel Changes

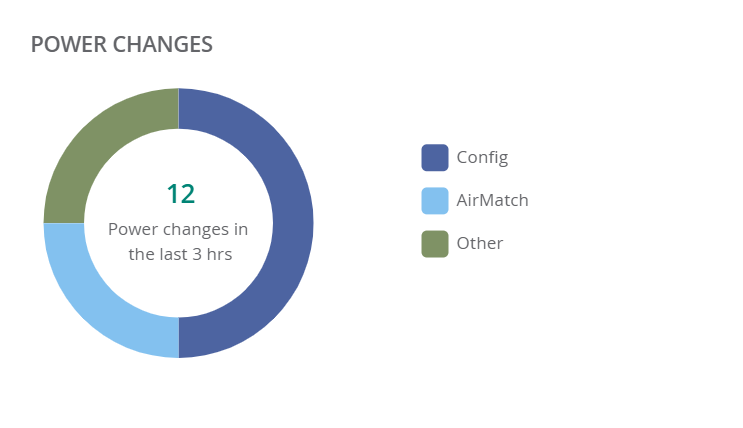
Power Changes
The graph indicates the power change by each of the radios, from ARMAdaptive Radio Management. ARM dynamically monitors and adjusts the network to ensure that all users are allowed ready access. It enables full utilization of the available spectrum to support maximum number of users by intelligently choosing the best RF channel and transmit power for APs in their current RF environment. to AirMatch EIRPEffective Isotropic Radiated Power or Equivalent Isotropic Radiated Power. EIRP refers to the output power generated when a signal is concentrated into a smaller area by the Antenna..
Figure 4 Power Changes


