
Access Point > Overview > RF
In the access point (AP) dashboard, the tab provides details corresponding to 2.4 GHzGigahertz., 5 GHz, and 5 GHz Secondary radios of the AP.
Viewing the Overview > RF Tab
To navigate to the tab in the AP dashboard, complete the following steps:
-
In the app, set the filter to one of the options under groups, labels, or sites. For all devices, set the filter to . Ensure that the filter selected contains at least one active AP.
The dashboard context for the selected filter is displayed.
-
Under , click > .
A list of APs is displayed in the view.
-
Click an AP listed under .
The dashboard context for the AP is displayed.
-
In the AP dashboard context, click the tab.
The tab is displayed.
To exit the AP dashboard, click the back arrow on the filter.
You can change the time range for the tab by clicking the time range filter and selecting one of the available options: , , , , and .
You can hover over the graph to view more information. You can select or clear an option in each graph to filter the data displayed on the graph. For example, if you uncheck the box corresponding to Receiving and Non-Wifi interference in the graph, only Transmitting data is displayed on the graph.
The tab provides the following details corresponding to 2.4 GHz and 5 GHz radio channels of the AP:
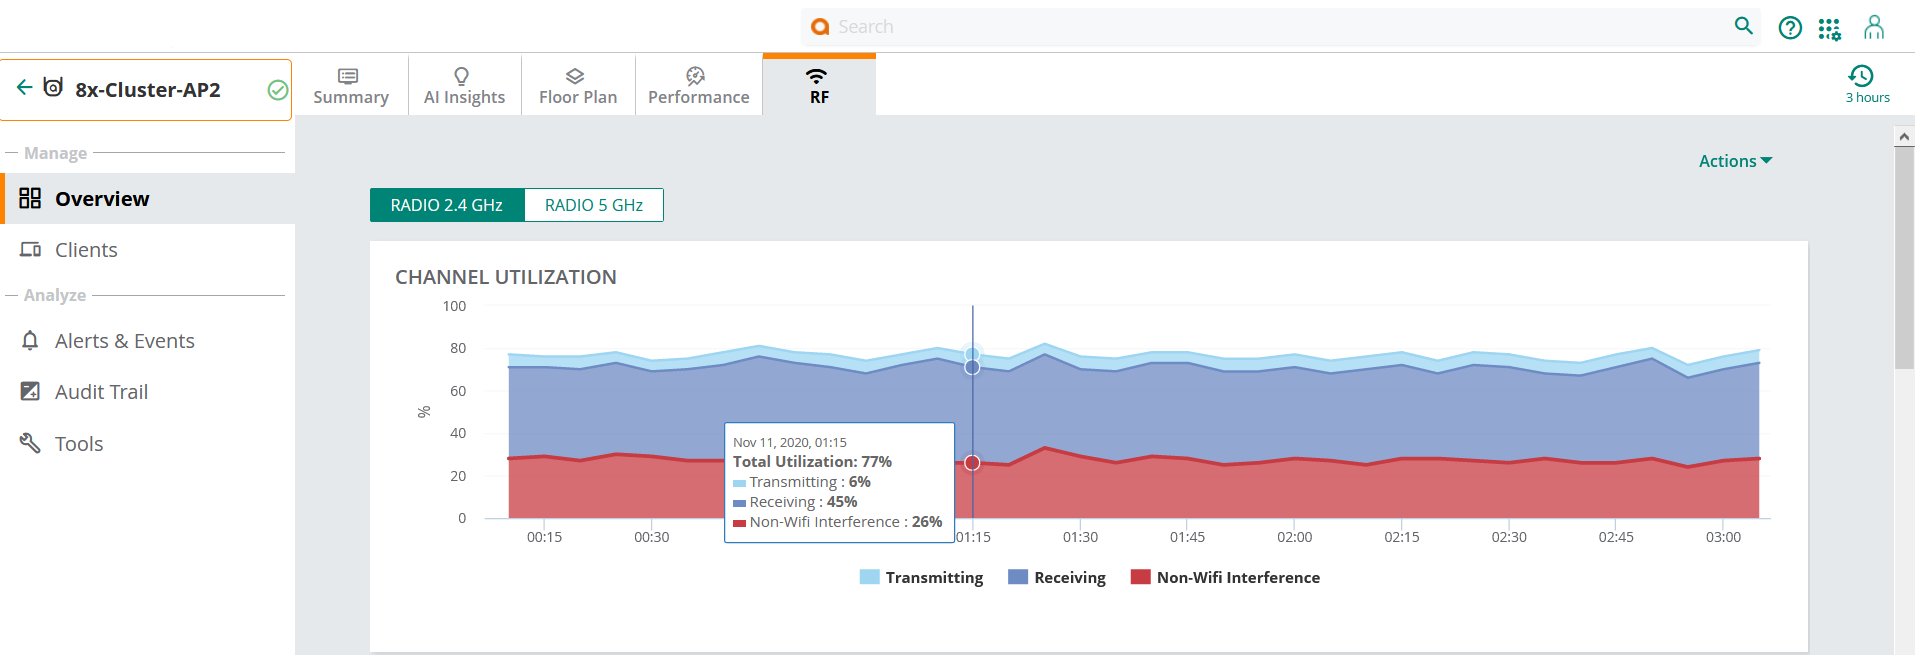
Channel Utilization
The graph indicates the percentage of channel utilization for the selected time range from the time range filter. The channel utilization information is categorized as follows:
- Transmitting: The percentage of channel currently being transmitted.
- Receiving: The percentage of channel currently being received.
- Non-Wifi Interference: The percentage of channel currently being used by non-Wi-FiWi-Fi is a technology that allows electronic devices to connect to a WLAN network, mainly using the 2.4 GHz and 5 GHz radio bands. Wi-Fi can apply to products that use any 802.11 standard. interferers.
Total Utilization is the sum of Transmitting, Receiving, and Non-Wifi interference, which indicates the total percentage of channel utilization for the selected time range.
The following figure displays the channel utilization graph for 2.4 GHz radio channel:
Noise Floor
The graph indicates the noise floor detected in the network to which the device belongs.
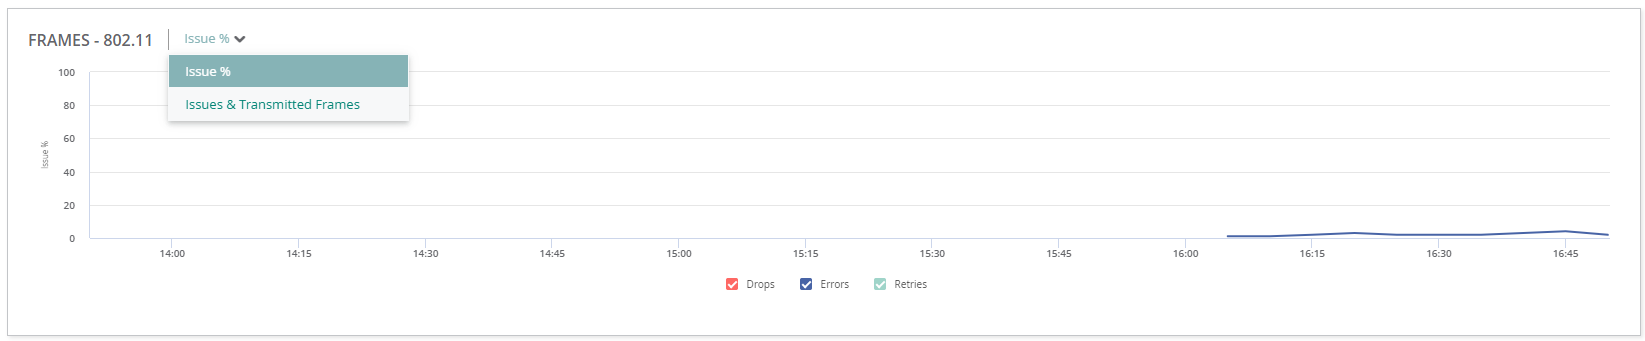
Frames - 802.11
The line graph indicates the trend of frames transmitted through the network. The frames can be one of the following types: , , and . The graph indicates the status of data frames that were dropped, encountered errors, retried to be transferred, in a wireless network. You can see the graph in percentage or frames/sec.
Only Campus APsCampus APs are used in private networks where APs connect over private links (LAN, WLAN, WAN or MPLS) and terminate directly on controllers. Campus APs are deployed as part of the indoor campus solution in enterprise office buildings, warehouses, hospitals, universities, and so on. and Remote APsRemote APs extend corporate network to the users working from home or at temporary work sites. Remote APs are deplyed at branch office sites and are connected to the central network on a WAN link. support the Issues & Transmitted Frames and Issue % filter options.
Select one of the following option from the drop-down:
- Issues & Transmitted Frames—Select to view the trend value for transmitted frames along with retries, errors, and drops in frames per second
- Issue %—Select to view the trend value for retries, errors, and drops in percentage.
Figure 1 Frames - 802.11 Graph
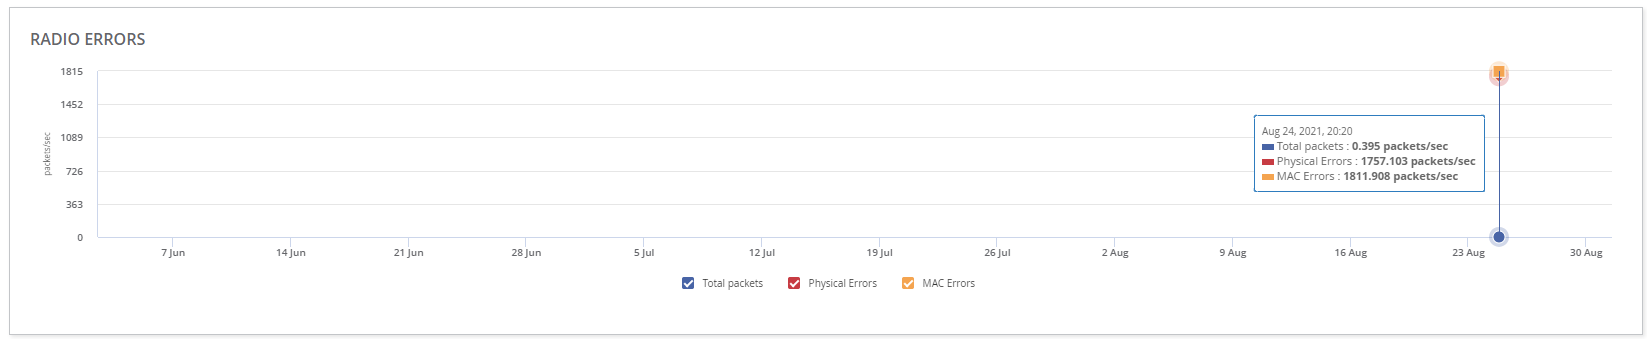
Radio Errors
The graph indicates the Total Packets, Physical Errors, and MACMedia Access Control. A MAC address is a unique identifier assigned to network interfaces for communications on a network. Errors in packets per second.
Only Campus APs and Remote APs support the Physical Errors, and MAC Errors options.
Figure 2 Radio Errors Graph
Channel Quality
The graph indicates the quality of channel in percentage.
When you hover over the , , , and graphs, it displays specific data for the selected timestamp.
The tri-radio feature is available only for AP-555. In the tab, the tab is available only if the tri-radio mode is enabled. For more information, see About Tri-Radio Mode.
Actions
The drop-down list contains the following options:
- —Reboots the AP. For more information, see Rebooting an AP in the Details Page.
- —Reboots the AP cluster. For more information, see Rebooting an IAP Cluster .
- —Enables the administrator to generate a tech support dump required for troubleshooting the AP. For more information, see Tech Support for an IAP .
Go Live
Aruba Central (on-premises) supports live monitoring of IAPs that support Aruba Instant 8.4.0.0 firmware version and above. Aruba Central (on-premises) allows you to monitor live data of an AP updated at every 5 seconds. For more information, see Enabling Live IAP Monitoring.
