
Controller > Overview > Summary
The tab under > in the controller dashboard displays the following two sections:
Device Info
Health Status
Viewing the Overview > Summary Tab
To navigate to the tab in the controller dashboard, complete the following steps:
1. In the app, set the filter to one of the options under , , or . Ensure that the filter selection contains at least one controller. For all devices, set the filter to .
The dashboard context for the selected filter is displayed.
2. Under > , click the tab.
A list of controllers is displayed.
3. Click a controller or cluster under .
The dashboard context for the specific controller or cluster is displayed.
4. Under , click > .
To exit the controller dashboard, click the back arrow on the filter.
You can change the time range for the tab by clicking the time range filter and selecting one of the available options: , , , , and .
Device Info
The section displays the following details.
Figure 1 Device Info
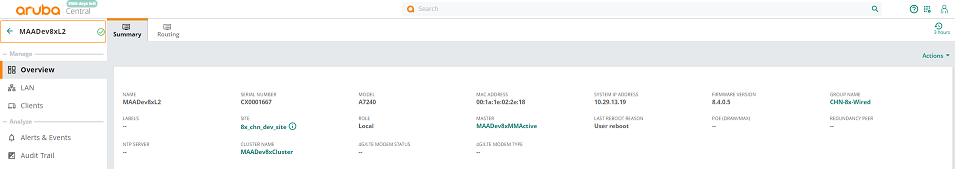
—The name of the controller.
—The serial number of the controller.
—The hardware model of the controller.
—The MACMedia Access Control. A MAC address is a unique identifier assigned to network interfaces for communications on a network. address of the controller.
—The IP address of the controller.
—The firmware version running on the controller. If a new version of the firmware is available, this information is also displayed. Clicking on the new firmware version redirects you to the Maintain > Firmware > controller page in the controller dashboard, where you can select the controller to upgrade it.
—The name of the group, if the controller is configured as part of a group. Click the group name to go to the Overview > Summary page for that group.
—The name of the label, if the controller is configured as part of a single or multiple labels.
—The name of the site, if the controller is configured as part of a site. Hover over the i icon to display the complete address of the site. Click the site name to go to the Overview > Site Health page for that site.
— The role of the controller; for example, master or local.
— The name of the master controller.
—The reason for the last reboot.
—The amount of power that the devices connected to the controller consume and the maximum PoEPower over Ethernet. PoE is a technology for wired Ethernet LANs to carry electric power required for the device in the data cables. The IEEE 802.3af PoE standard provides up to 15.4 W of power on each port. power capacity. For example, if the value displayed is 6/120, the devices draw 6 watts and the maximum PoE power allocated is 120 watts.
—Displays the redundant controller if it is configured.
—The name of the NTPNetwork Time Protocol. NTP is a protocol for synchronizing the clocks of computers over a network. server configured and its synchronization status.
—The name of the cluster controller.
—Displays the modem connectivity status. The status shows only 'Connected' when the modem type is not internal.
—Displays the LTELong Term Evolution. LTE is a 4G wireless communication standard that provides high-speed wireless communication for mobile phones and data terminals. See 4G. connection type.
—The status of the configuration sync. Hover over the i icon to display the last successful configuration sync time.
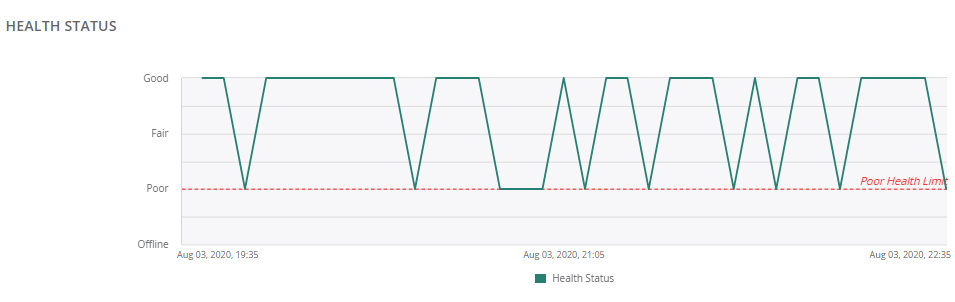
Health Status
The section displays the health of the controller in terms of CPUCentral Processing Unit. A CPU is an electronic circuitry in a computer for processing instructions., Memory and device connectivity to Aruba Central (on-premises).
The health status is plotted using health indicators such as Good, Fair, Poor and Offline. You can hover over the chart to see the health status for a particular time frame.
Figure 2 Health Status
Action
The Action drop-down list contains an option to reboot the controller. For more information, see Rebooting Controllers.
