Controller > LAN > Summary
The tab under > page in the controller dashboard displays the following sections:
Viewing the LAN > Summary Tab
To navigate to the tab in the controller dashboard, complete the following steps:
- In the app, set the filter to one of the options under , , or . Ensure that the filter selection contains at least one controller. For all devices, set the filter to .
The dashboard context for the selected filter is displayed.
- Under > , click the tab.
A list of controllers is displayed.
- Click a controller or cluster under .
The dashboard context for the specific controller is displayed.
- Under , click > .
To exit the controller dashboard, click the back arrow on the filter.
You can change the time range for the tab by clicking the time range filter and selecting one of the available options: , , , , and .
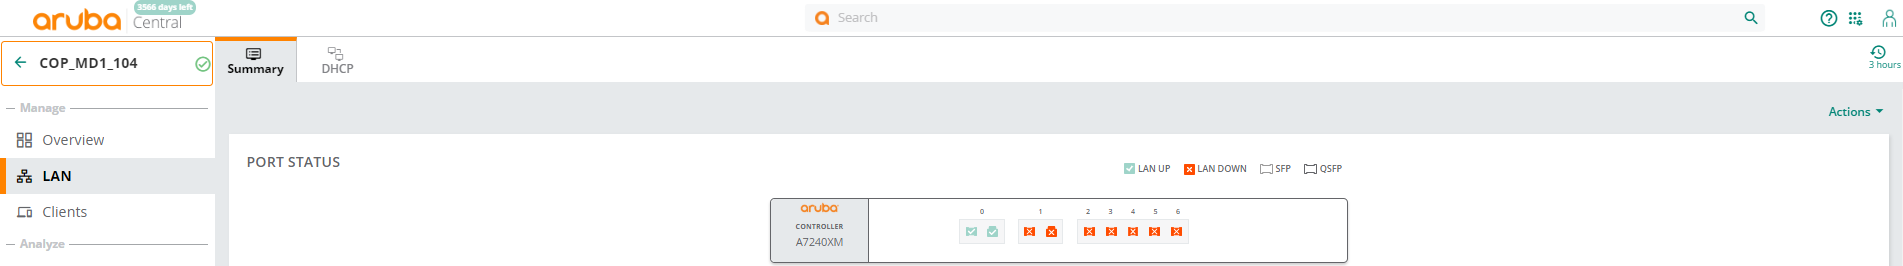
Port Status
Provides a graphical representation of the Branch Gateway's LANLocal Area Network. A LAN is a network of connected devices within a distinct geographic area such as an office or a commercial establishment and share a common communications line or wireless link to a server. link availability. Also provides a quick view of the LAN port status. Click a LAN port to view the port detail graphs based on Packets or Errors.
Figure 1 Port Status
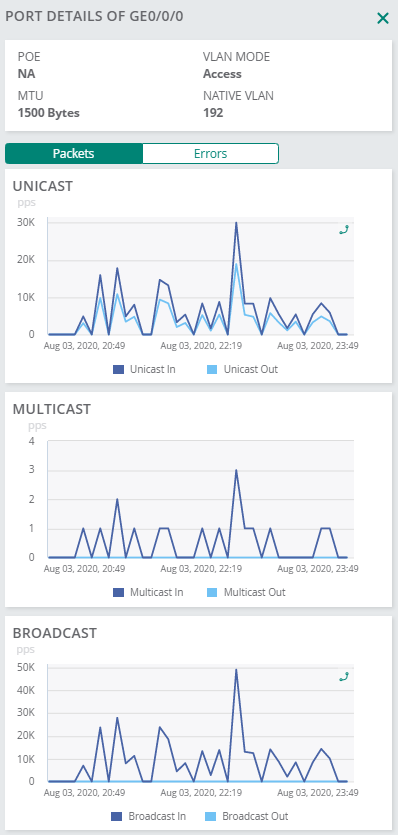
The following graphs are displayed under the tab:
- —The number of unicast packets per second.
- —The number of multicast packets per second.
- —The number of broadcast packets per second.
Figure 2 Port Details - Packet
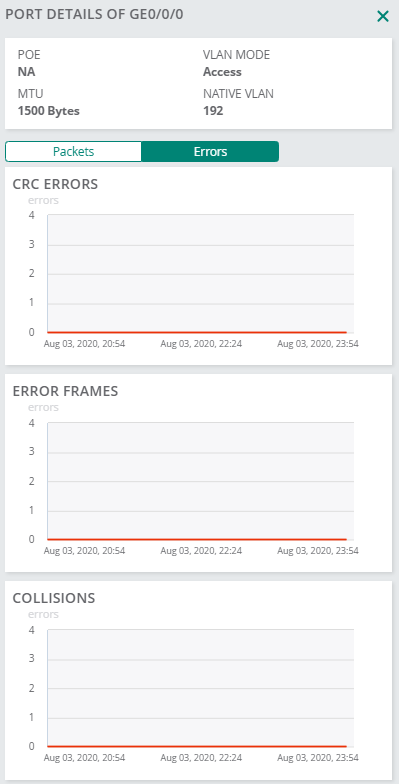
The following graphs are displayed under the tab:
- —The number of cyclic redundancy errors logged.
- —The number of error frames logged.
- —The number of collisions encountered.
Figure 3 Port Details - Errors
LAN Interfaces Summary
The table displays the summary of LAN interfaces total number of LAN interfaces. The following details are displayed for the port:
- —Port number.
- —Administrative state of the LAN interface.
- —Operational state of the LAN interface.
- —Port speed.
- —Range of VLANsVirtual Local Area Network. In computer networking, a single Layer 2 network may be partitioned to create multiple distinct broadcast domains, which are mutually isolated so that packets can only pass between them through one or more routers; such a domain is referred to as a Virtual Local Area Network, Virtual LAN, or VLAN..
- —MTUMaximum Transmission Unit. MTU is the largest size packet or frame specified in octets (eight-bit bytes) that can be sent in networks such as the Internet. value.
Figure 4 LAN Interface Summary
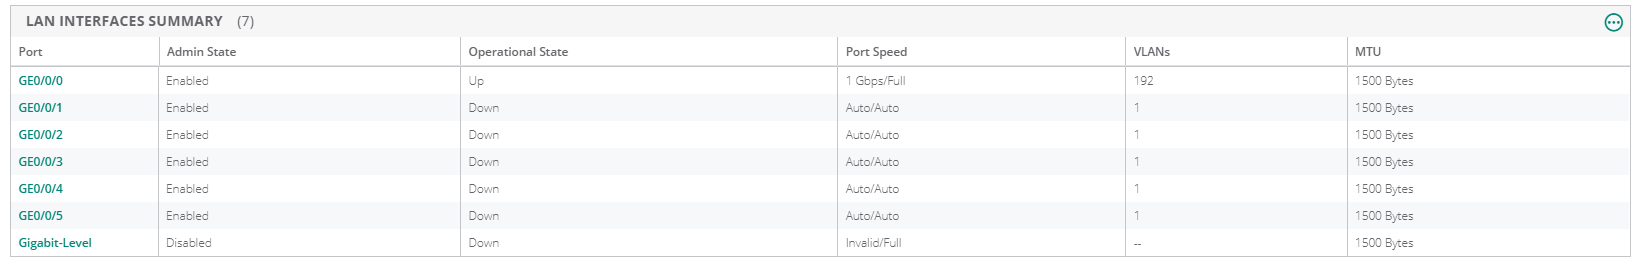
Click a LAN port to view the port detail graphs based on Packets or Errors. For more information, see Port Status.
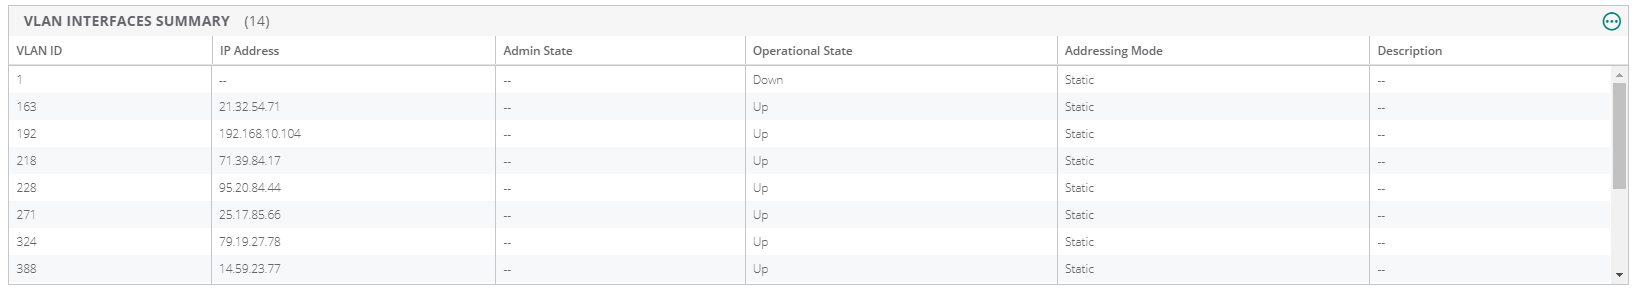
VLAN Interface Summary
The table displays the summary of VLAN interfaces and total number of VLAN interfaces. The following details are displayed:
- —VLAN ID number.
- —IP address.
- —Administrative state of the VLAN interface.
- —Operational state of the VLAN interface.
- —Type of addressing mode.
- —Description of the VLAN.
Figure 5 VLAN Interfaces Summary