Aruba Central Online Help

The Health Bar

The Health Bar provides a snapshot of the overall health of the devices configured as part of the specific dashboard. The applicable dashboards include global, group, site, client, and device dashboards.

The topic discusses the following:

Viewing the Health Bar Dashboard

To view the Health Bar, perform the following steps:

  1. In the Network Operations app, select one of the following options:
    • To select a group, label, site, or all devices in the filter, set the filter to one of the options under Groups, Labels, or Sites. For all devices, set the filter to Global.

      The dashboard context for the selected filter is displayed.

    • To select a device in the filter:
      1. Set the filter to Global.
      2. Under Manage, click Devices, and then click Access Points, Switches, or Gateways.

        A list of devices is displayed in the List view.

      3. Click a device listed under Device Name.

        The dashboard context for the device is displayed.

    • To select a client:
      1. Set the filter to Global.
      2. Under Manage, click Clients.

        A list of clients is displayed in the List view.

      3. Click a client listed under Client Name.

        The dashboard context for the client is displayed.

      The Health Bar icon displays the overall health of the network of the selected filter as either online or offline.

  2. In the selected filter, click the Health Bar icon to expand the Health Bar dashboard.
  3. Use the pin icon to pin the Health Bar dashboard to the Network Operations app display.

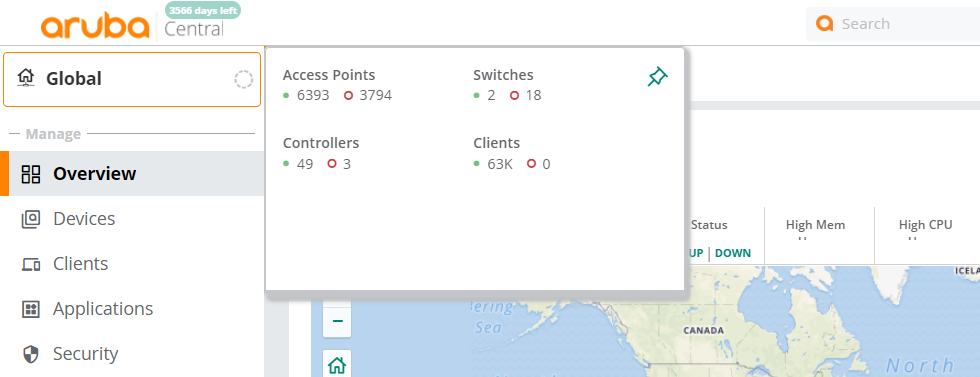
Health Bar Dashboard for Global

The following image shows the health bar for the global dashboard.

Figure 1  Expanded but Unpinned Health Bar in the Global Dashboard

Icon Types

Icon Type

Description

  • For devices, indicates the number of devices that are online.
  • For clients, indicates the number of clients that are connected.

  • For devices, indicates the number of devices that are offline.
  • For clients, indicates the number of failed clients.
  • For AI Insights, indicates the number of insights that are of high priority.

For AI Insights, indicates the number of insights that are of medium priority.

For AI Insights, indicates the number of insights that are of low priority.

The following table includes information on the various parameters of the Health Bar displayed for a global dashboard. The health bar in a global dashboard is in the context of all devices.

Parameter

Description

Access Points

  • Displays the number of access points that are online and the number of access points that are offline.
  • The number in green indicates the number of access points that are online.
  • Clicking the number in green redirects you to Manage > Devices > Access Points > Online in List view.
  • The number in red indicates the number of access points that are offline.
  • Clicking the number in red redirects you to Manage > Devices > Access Points > Offline in List view.

Switches

  • Displays the number of switches that are online and the number of switches that are offline.
  • The number in green indicates the number of switches that are online.
  • Clicking the number in green redirects you to Manage > Devices > Switches > Online in Listview.
  • The number in red indicates the number of switches that are offline.
  • Clicking the number in red redirects you to Manage > Devices > Switches > Offline in List view.

Controllers

  • Displays the number of controllers that are online and the number of controllers that are offline.
  • The number in green indicates the number of controllers that are online.
  • Clicking the number in green redirects you to Manage > Devices > Controllers > Online in List view.
  • The number in red indicates the number of controllers that are offline.
  • Clicking the number in red redirects you to Manage > Devices > Controllers > Offline in List view.

Clients

  • Displays the number of clients that are connected and the number of clients that are failed.
  • The number in green indicates the number of clients that are connected.
  • The number in red indicates the number of clients that are failed.
  • Clicking the numbers redirects you to Manage > Clients > Clients in List view.

Health Bar Dashboard for Group

The following table includes information on the various parameters of the Health Bar displayed for a group dashboard. The health bar in a group dashboard is in the context of all devices configured as part of that group.

Parameter

Description

Access Points

  • Displays the number of access points that are online and the number of access points that are offline.
  • The number in green indicates the number of access points that are online.
  • Clicking the number in green redirects you to Manage > Devices > Access Points > Online in List view.
  • The number in red indicates the number of access points that are offline.
  • Clicking the number in red redirects you to Manage > Devices > Access Points > Offline in List view.

Switches

  • Displays the number of switches that are online and the number of switches that are offline.
  • The number in green indicates the number of switches that are online.
  • Clicking the number in green redirects you to Manage > Devices > Switches > Online in List view.
  • The number in red indicates the number of switches that are offline.
  • Clicking the number in red redirects you to Manage > Devices > Switches > Offline in List view.

Controllers

  • Displays the number of controllers that are online and the number of controllers that are offline.
  • The number in green indicates the number of controllers that are online.
  • Clicking the number in green redirects you to Manage > Devices > Controllers > Online in List view.
  • The number in red indicates the number of controllers that are offline.
  • Clicking the number in red redirects you to Manage > Devices > Controllers > Offline in List view.

Clients

  • Displays the number of clients that are connected and the number of clients that are failed.
  • The number in green indicates the number of clients that are connected.
  • The number in red indicates the number of clients that are failed.
  • Clicking the numbers redirects you to Manage > Clients > Clients in List view.

Health Bar Dashboard for Site

The following table includes information on the various parameters of the Health Bar displayed for a site dashboard. The health bar in a site dashboard is in the context of all devices configured as part of that site.

Parameter

Description

Access Points

  • Displays the number of access points that are online and the number of access points that are offline.
  • The number in green indicates the number of access points that are online.
  • Clicking the number in green redirects you to Manage > Devices > Access Points > Online in List view.
  • The number in red indicates the number of access points that are offline.
  • Clicking the number in red redirects you to Manage > Devices > Access Points > Offline in List view.

Switches

  • Displays the number of switches that are online and the number of switches that are offline.
  • The number in green indicates the number of switches that are online.
  • Clicking the number in green redirects you to Manage > Devices > Switches > Online in List view.
  • The number in red indicates the number of switches that are offline.
  • Clicking the number in red redirects you to Manage > Devices > Switches > Offline in List view.

Controllers

  • Displays the number of controllers that are online and the number of controllers that are offline.
  • The number in green indicates the number of controllers that are online.
  • Clicking the number in green redirects you to Manage > Devices > Controllers > Online in List view.
  • The number in red indicates the number of controllers that are offline.
  • Clicking the number in red redirects you to Manage > Devices > Controllers > Offline in List view.

Clients

  • Displays the number of clients that are connected and the number of clients that are failed.
  • The number in green indicates the number of clients that are connected.
  • The number in red indicates the number of clients that are failed.
  • Clicking the numbers redirects you to Manage > Clients > Clients in List view.

AI Insights

  • Displays the number of insights categorized by status.
  • The number in red indicates the insights are of high priority.

  • The number in orange indicates the insights are of medium priority.

  • The number in yellow indicates the insights are of low priority.

  • Clicking the numbers redirects you to Manage > Overview > AI Insights at the site context.

Health Bar Dashboard for Access Point

The following table includes information on the various parameters of the Health Bar displayed for an AP. If the AP is not online and running, not all of the following data is available.

Parameter

Description

AP Status

  • Value can be Online Since, Offline, or Operating under Thermal Management.
  • If the value is Online Since, it also displays the time period, in the format of days-hours-minutes, for which the AP has been online and running.
  • When an AP operates under thermal management, the device health is displayed as Poor and the radios are in disabled mode. For more information, see Thermal Shutdown Support in IAP.

Device Health

  • Displays the performance of the AP in terms of the CPUCentral Processing Unit. A CPU is an electronic circuitry in a computer for processing instructions. and memory usage.
  • For example, the device health is Good when the CPU usage is less than or equal to 70% and the memory usage is less than or equal to 90%. If the value of the CPU and/or memory usage falls below the threshold, the device health is displayed as Poor. If the AP is down, the value is Offline. If the scenario is not applicable, a “-” sign is displayed.
  • Hover over the Device Health status to get the exact percentage value of the memory and CPU usage.

Radio 2.4 GHz

Radio 5 GHz

  • Displays the performance of the AP in terms of the channel utilization and noise floor in the 5 GHz channel.
  • For example, the device health is Good when the channel utilization is less than or equal to 70% and the noise floor is less than or equal to -80 dBm. If the value of the channel utilization and noise floor falls below the threshold, the device health is displayed as Poor If the AP is online, but the radio is down, the value displayed is Disabled. If the scenario is not applicable, a “-” sign is displayed.
  • Hover over the Radio 5 GHz status to get the exact value of the channel utilization and noise floor.

Radio 5 GHz (Secondary)

  • Displays the performance of the AP in terms of the channel utilization and noise floor in the 5 GHz (Secondary) channel.
  • For example, the device health is Good when the channel utilization is less than or equal to 70% and the noise floor is less than or equal to -80 dBm. If the value of the channel utilization and noise floor falls below the threshold, the device health is displayed as Poor. If the AP is online, but the radio is down, the value displayed is Disabled. If the scenario is not applicable, a “-” sign is displayed.
  • Hover over the Radio 5 GHz (Secondary) status to get the exact value of the channel utilization and noise floor.

In the Health Bar dashboard, the Radio 5 GHz (Secondary) data is available only for AP-555 and only if the tri-radio mode is enabled. For more information, see About Tri-Radio Mode.

Virtual Controller

Indicates if the AP is connected to a virtual controller. If the AP is connected, clicking on the virtual controller name redirects you to the Manage > Overview > Summary page for the virtual controller.

Health Bar Dashboard for Switch

The following table includes information on the various parameters of the Health Bar displayed for a switch. If the switch is not online and running, not all of the following data is available.

Parameter

Description

Switch Status

Displays the time period for which the switch has been online and running or its offline status.

Device Health

  • Displays the performance of the switch in terms of the CPU and memory usage.
  • For example, the device health is Good when the CPU usage is less than or equal to 70% and the memory usage is less than or equal to 70%. If the value of the CPU and/or memory usage falls below the threshold, the device health is displayed as Poor.
  • Hover over the Device Health status to get the exact percentage value of the memory and CPU usage.

Port - Status

  • Displays the number of ports on the switch that are online and the number of ports that are offline.
  • The number in green indicates the number of switch ports that are online.
  • The number in red indicates the number of switch ports that are offline.

Port - Alerts

  • Displays the total number of open alerts.

Health Bar Dashboard for Controller

The following table includes information on the various parameters of the Health Bar displayed for a controller. If the controller is not online and running, not all of the following data is available.

Parameter

Description

Controller Status

Displays the time period, in the format of days-hours-minutes, for which the controller has been running or its offline status.

LAN

Alerts

  • Displays the total number of open alerts.
  • Clicking the number redirects you to Analyze > Alerts & Events in List view.

Health Bar Dashboard for Wireless Client

The following table includes information on the various parameters of the Health Bar displayed for a wireless client.

Parameter

Description

Client Status

Displays the connection status of the client.

Device Health

Displays the device health of the client.

Signal Quality

Displays the signal quality in dBDecibel. Unit of measure for sound or noise and is the difference or ratio between two signal levels..

Tx | Rx Rate

Displays the transmit and receive rate in MbpsMegabits per second.

Connected To

  • Displays the device to which the wired client is connected.
  • Clicking on the device redirects you to the Manage > Overview > Summary page for that device.

Refresh icon

Refreshes the data on the Health Bar for the client.

Health Bar Dashboard for Wired Client

The following table includes information on the various parameters of the Health Bar displayed for a wired client.

Parameter

Description

Client Status

Displays the connection status of the client.

Connected Port

Displays the port to which the client is connected.

Connected To

  • Displays the device to which the wired client is connected.
  • Clicking on the device redirects you to the Manage > Overview > Summary page for that device.

Refresh icon

Refreshes the data on the Health Bar for the client.