
The Health Bar
The Health Bar provides a snapshot of the overall health of the devices configured as part of the specific dashboard. The applicable dashboards include global, group, site, client, and device dashboards.
The topic discusses the following:
Health Bar for the Global Dashboard
Health Bar for the Group Dashboard
Health Bar for the Site Dashboard
Health Bar for the Access Point Dashboard
Health Bar for the Switch Dashboard
Health Bar Dashboard for the Controller Dashboard
Health Bar for the Wireless Client Dashboard
Health Bar for the Wired Client Dashboard
Viewing the Health Bar Dashboard
To view the Health Bar, perform the following steps:
1. In the app, select one of the following options:
To select a group, label, site, or all devices in the filter, set the filter to one of the options under , , or . For all devices, set the filter to .
The dashboard context for the selected filter is displayed.
To select a device in the filter:
a. Set the filter to .
b. Under , click , and then click , , or .
A list of devices is displayed in the view.
c. Click a device listed under .
The dashboard context for the device is displayed.
To select a client:
a. Set the filter to .
b. Under , click .
A list of clients is displayed in the view.
c. Click a client listed under .
The dashboard context for the client is displayed.
The Health Bar icon displays the overall health of the network of the selected filter as either online or offline.
2. In the selected filter, click the Health Bar icon to expand the Health Bar dashboard.
3. Use the ![]() pin icon to pin the Health Bar dashboard to the app display.
pin icon to pin the Health Bar dashboard to the app display.
Health Bar for the Global Dashboard
The following image shows the health bar for the global dashboard.
Figure 1 Expanded but Unpinned Health Bar in the Global Dashboard
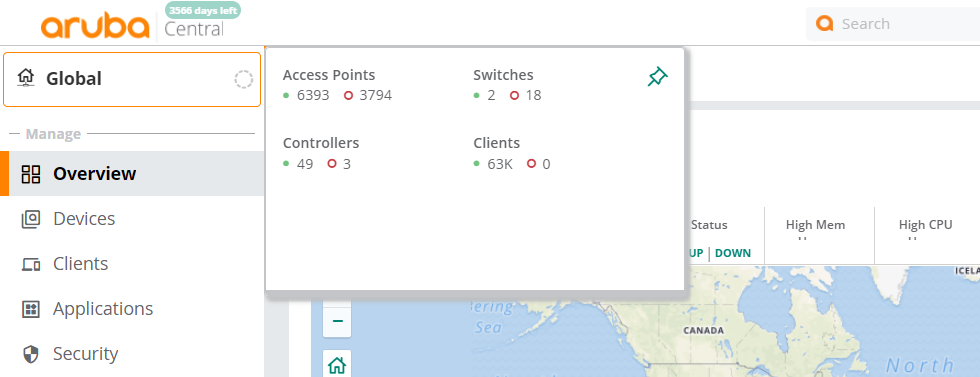
The following table includes information on the various parameters of the Health Bar displayed for a global dashboard. The health bar in a global dashboard is in the context of all devices.
|
Parameter |
Description |
|---|---|
|
|
Displays the number of access points that are online and the number of access points that are offline. The number in green indicates the number of access points that are online. Clicking the number in green redirects you to > > inview. The number in red indicates the number of access points that are offline. Clicking the number in red redirects you to > > inview. |
|
|
Displays the number of switches that are online and the number of switches that are offline. The number in green indicates the number of switches that are online. Clicking the number in green redirects you to > > inview. The number in red indicates the number of switches that are offline. Clicking the number in red redirects you to > > inview. |
|
|
Displays the number of controllers that are online and the number of controllers that are offline. The number in green indicates the number of controllers that are online. Clicking the number in green redirects you to > > inview. The number in red indicates the number of controllers that are offline. Clicking the number in red redirects you to > > inview. |
|
|
Displays the number of clients that are connected and the number of clients that are failed. The number in green indicates the number of clients that are connected. The number in red indicates the number of clients that are failed. Clicking the numbers redirects you to > > inview. |
Health Bar for the Group Dashboard
The following table includes information on the various parameters of the Health Bar displayed for a group dashboard. The health bar in a group dashboard is in the context of all devices configured as part of that group.
|
Parameter |
Description |
|---|---|
|
|
Displays the number of access points that are online and the number of access points that are offline. The number in green indicates the number of access points that are online. Clicking the number in green redirects you to > > inview. The number in red indicates the number of access points that are offline. Clicking the number in red redirects you to > > inview. |
|
|
Displays the number of switches that are online and the number of switches that are offline. The number in green indicates the number of switches that are online. Clicking the number in green redirects you to > > inview. The number in red indicates the number of switches that are offline. Clicking the number in red redirects you to > > inview. |
|
|
Displays the number of controllers that are online and the number of controllers that are offline. The number in green indicates the number of controllers that are online. Clicking the number in green redirects you to > > inview. The number in red indicates the number of controllers that are offline. Clicking the number in red redirects you to > > inview. |
|
|
Displays the number of clients that are connected and the number of clients that are failed. The number in green indicates the number of clients that are connected. The number in red indicates the number of clients that are failed. Clicking the numbers redirects you to > > inview. |
Health Bar for the Site Dashboard
The following table includes information on the various parameters of the Health Bar displayed for a site dashboard. The health bar in a site dashboard is in the context of all devices configured as part of that site.
|
Parameter |
Description |
|---|---|
|
|
Displays the number of access points that are online and the number of access points that are offline. The number in green indicates the number of access points that are online. Clicking the number in green redirects you to > > inview. The number in red indicates the number of access points that are offline. Clicking the number in red redirects you to > > inview. |
|
|
Displays the number of switches that are online and the number of switches that are offline. The number in green indicates the number of switches that are online. Clicking the number in green redirects you to > > inview. The number in red indicates the number of switches that are offline. Clicking the number in red redirects you to > > inview. |
|
|
Displays the number of controllers that are online and the number of controllers that are offline. The number in green indicates the number of controllers that are online. Clicking the number in green redirects you to > > inview. The number in red indicates the number of controllers that are offline. Clicking the number in red redirects you to > > inview. |
|
|
Displays the number of clients that are connected and the number of clients that are failed. The number in green indicates the number of clients that are connected. The number in red indicates the number of clients that are failed. Clicking the numbers redirects you to > > inview. |
|
|
Displays the number of insights categorized by status. The number in green indicates the insights impact is less than or equal to 1%. The number in yellow indicates the insights impact is more than 1% and less than or equal to 10%. The number in red indicates the insights impact is more than 10%. Clicking the numbers redirects you to > > inview. |
Health Bar for the Access Point Dashboard
The following table includes information on the various parameters of the Health Bar displayed for an AP. If the AP is not online and running, not all of the following data is available.
|
Parameter |
Description |
|---|---|
|
|
Value can be , , or . If the value is , it also displays the time period, in the format of days-hours-minutes, for which the AP has been online and running. When an AP operates under thermal management, the device health is displayed as and the radios are in disabled mode. For more information, see Thermal Shutdown Support in Instant AP. |
|
|
Displays the performance of the AP in terms of the CPUCentral Processing Unit. A CPU is an electronic circuitry in a computer for processing instructions. and memory usage. For example, the device health is when the CPU usage is less than or equal to 70% and the memory usage is less than or equal to 90%. If the value of the CPU and/or memory usage falls below the threshold, the device health is displayed as . If the AP is down, the value is . If the scenario is not applicable, a “-” sign is displayed. Hover over the status to get the exact percentage value of the memory and CPU usage. |
|
|
Displays the performance of the AP in terms of the channel utilization and noise floor in the 2.4 GHzGigahertz. channel. For example, the device health is when the channel utilization is less than or equal to 70% and the noise floor is less than or equal to -80 dBmDecibel-Milliwatts. dBm is a logarithmic measurement (integer) that is typically used in place of mW to represent receive-power level. AMP normalizes all signals to dBm, so that it is easy to evaluate performance between various vendors.. If the value of the channel utilization and noise floor falls below the threshold, the device health is displayed as . If the AP is online, but the radio is down, the value displayed is . If the scenario is not applicable, a “-” sign is displayed. Hover over the status to get the exact value of the channel utilization and noise floor. |
|
|
Displays the performance of the AP in terms of the channel utilization and noise floor in the 5 GHz channel. For example, the device health is when the channel utilization is less than or equal to 70% and the noise floor is less than or equal to -80 dBm. If the value of the channel utilization and noise floor falls below the threshold, the device health is displayed as If the AP is online, but the radio is down, the value displayed is . If the scenario is not applicable, a “-” sign is displayed. Hover over the status to get the exact value of the channel utilization and noise floor. |
|
|
Displays the performance of the AP in terms of the channel utilization and noise floor in the 5 GHz (Secondary) channel. For example, the device health is when the channel utilization is less than or equal to 70% and the noise floor is less than or equal to -80 dBm. If the value of the channel utilization and noise floor falls below the threshold, the device health is displayed as . If the AP is online, but the radio is down, the value displayed is . If the scenario is not applicable, a “-” sign is displayed. Hover over the status to get the exact value of the channel utilization and noise floor. In the Health Bar dashboard, the data is available only for AP-555 and only if the tri-radio mode is enabled. For more information, see Tri-Radio Mode. |
|
|
Indicates if the AP is connected to a virtual controller. If the AP is connected, clicking on the virtual controller name redirects you to the > > page for the virtual controller. |
Health Bar for the Switch Dashboard
The following table includes information on the various parameters of the Health Bar displayed for a switch. If the switch is not online and running, not all of the following data is available.
|
Parameter |
Description |
|---|---|
|
|
Displays the time period for which the switch has been online and running or its offline status. |
|
|
Displays the performance of the switch in terms of the CPU and memory usage. For example, the device health is when the CPU usage is less than or equal to 70% and the memory usage is less than or equal to 70%. If the value of the CPU and/or memory usage falls below the threshold, the device health is displayed as . Hover over the status to get the exact percentage value of the memory and CPU usage. |
|
|
Displays the number of ports on the switch that are online and the number of ports that are offline. The number in green indicates the number of switch ports that are online. The number in red indicates the number of switch ports that are offline. |
|
|
Displays the total number of open alerts. |
Health Bar Dashboard for the Controller Dashboard
The following table includes information on the various parameters of the Health Bar displayed for a controller. If the controller is not online and running, not all of the following data is available.
|
Parameter |
Description |
|---|---|
|
Controller Status |
Displays the time period, in the format of days-hours-minutes, for which the controller has been running or its offline status. |
|
|
Displays the number of LANLocal Area Network. A LAN is a network of connected devices within a distinct geographic area such as an office or a commercial establishment and share a common communications line or wireless link to a server. ports as online or offline. The number in green indicates the number of LAN ports that are online. The number in red indicates the number of LAN ports that are offline. Clicking the numbers redirects you to > > . |
|
|
Displays the total number of open alerts. Clicking the number redirects you to > in view. |
Health Bar for the Wireless Client Dashboard
The following table includes information on the various parameters of the Health Bar displayed for a wireless client.
|
Parameter |
Description |
|---|---|
|
|
Displays the connection status of the client. |
|
|
Displays the device health of the client. |
|
|
Displays the signal quality in dBDecibel. Unit of measure for sound or noise and is the difference or ratio between two signal levels.. |
|
|
Displays the transmit and receive rate in MbpsMegabits per second. |
|
|
Displays the device to which the wired client is connected. Clicking on the device redirects you to the > > page for that device. |
|
Refresh icon |
Refreshes the data on the Health Bar for the client. |
Health Bar for the Wired Client Dashboard
The following table includes information on the various parameters of the Health Bar displayed for a wired client.
|
Parameter |
Description |
|---|---|
|
|
Displays the connection status of the client. |
|
|
Displays the port to which the client is connected. |
|
|
Displays the device to which the wired client is connected. Clicking on the device redirects you to the > > page for that device. |
|
Refresh icon |
Refreshes the data on the Health Bar for the client. |
