
Viewing Usage Statistics
The page includes the tab that displays the APIApplication Programming Interface. Refers to a set of functions, procedures, protocols, and tools that enable users to build application software. usage. The tab is available only for administrators and the usage data is stored only for the previous 30 days. The following details are displayed:
- Assigned rate limit.
- Total usage.
- Per user usage.
- Download CSVComma-Separated Values. A file format that stores tabular data in the plain text format separated by commas.
The administrator receives an alert through text message or email when the API usage reaches a threshold. You can set the threshold to 75% of the rate limit value.
To view the usage statistics for users of API Gateway, complete the following steps:
- In the page, under , click .
The page is displayed.
- Click . The following details are displayed:
Figure 1 API Gateway Usage Page
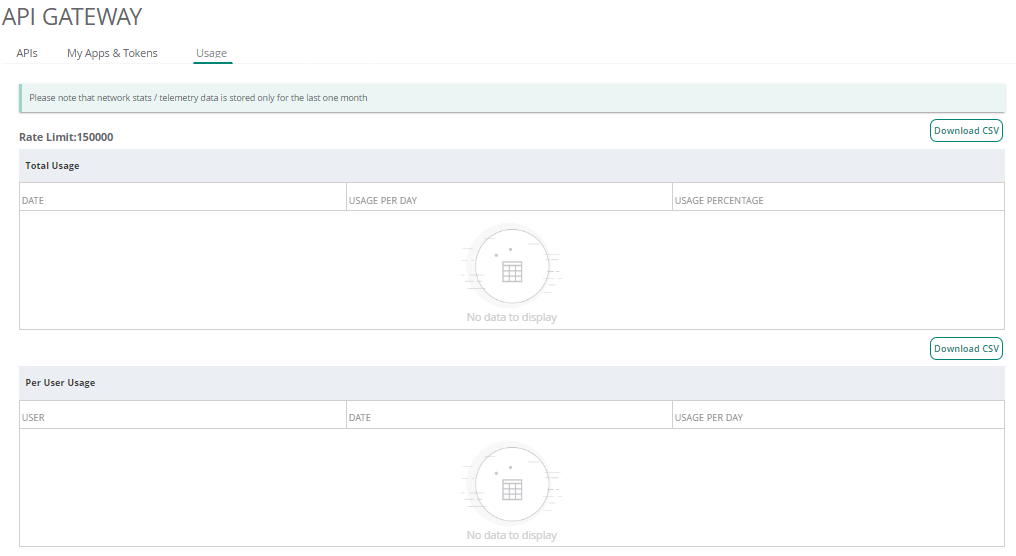
- —The total rate limit assigned for API calls for a month.
- :
- —The date of usage.
- —Usage per day.
- —Usage percentage for a specific date.
- :
- —The name of the user.
- —The date on which the application was accessed.
- —The total usage by the user per day. This is derived based on the total number of API calls made on a per day basis. This is an aggregate across all customers.
- — Allows you to download the stat CSV file. Click for the respective usage type to download the stat file in CSV format.
The tab is only available for administrators and the usage data is stored only for the previous 30 days.
