
Switch > Overview > Hardware
In the switch dashboard, the tab displays information related to power supplies, fans, utilization, and temperature.
The tab displays the following sections:
Viewing the Overview > Hardware Tab
Viewing the Overview > Hardware Tab
To navigate to the tab in the Switch dashboard, complete the following steps:
1. In the app, set the filter to one of the options under , , or . For all devices, set the filter to . Ensure that the filter selected contains at least one active switch.
The dashboard context for the selected filter is displayed.
2. Under , click > .
A list of switches is displayed in the view.
3. Click a switch listed under .
The dashboard context for the specific switch is displayed.
4. Under , click > .
The tab is displayed.
5. To exit the Switch dashboard, click the back arrow on the filter.
You can change the time range for the tab by clicking the time range filter and selecting one of the available options: , , , , or .
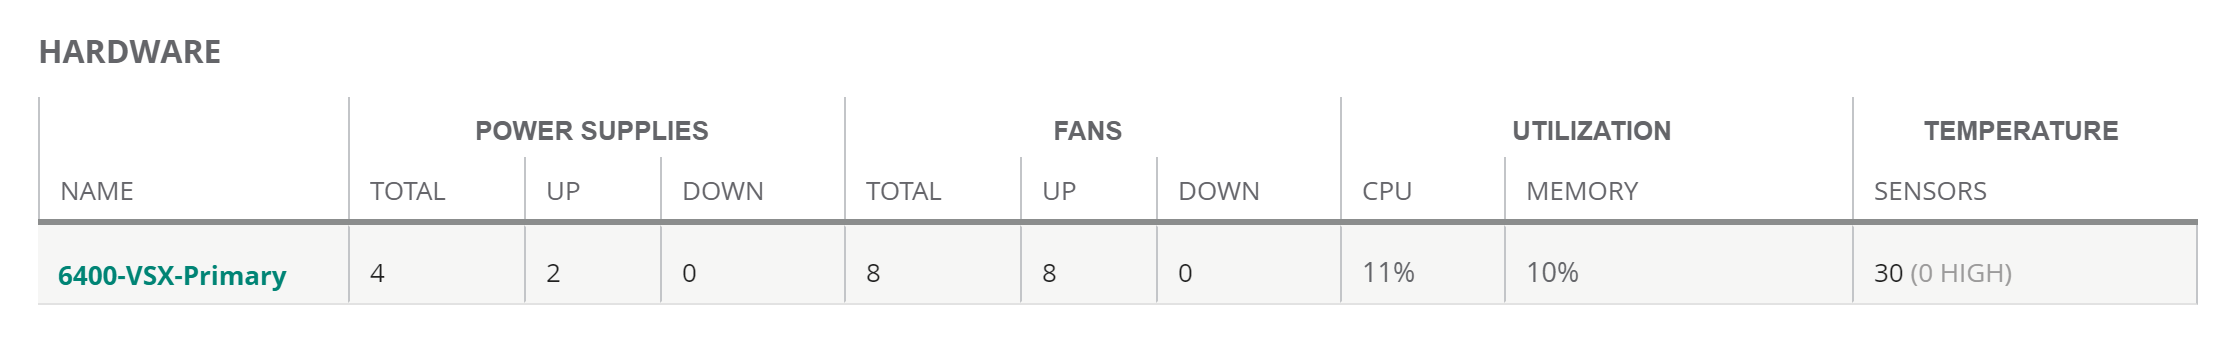
Hardware
The table displays the overall hardware summary:
—Identity of the hardware.
—Name of the device.
—Total number of power supplies.
—Number of power supplies in Up state.
—Number of power supplies in Down state.
—Total number of fans.
—Number of fans in Up state.
—Number of fans in Down state.
—Current CPU utilization percentage.
—Current memory utilization percentage.
—Current temperature. This column is available only for Aruba Switch series.
—Minimum temperature. This column is available only for Aruba Switch series.
—Maximum temperature. This column is available only for Aruba Switch series.
—Number of sensors present in the switch. The number inside the brackets show the number of sensors whose status is high. This column is available only for Aruba CX switches.
Figure 1 Hardware table details for Aruba Switch
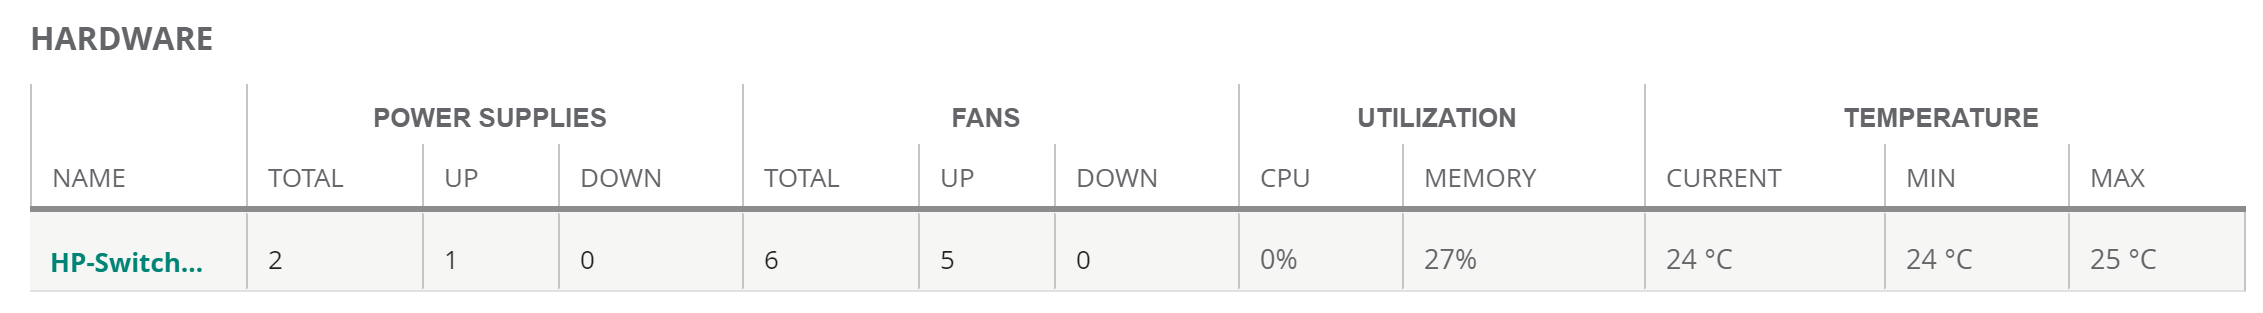
Figure 2 Hardware table details for Aruba CX switch
Power Supplies
The table displays the following details:
—Name of the power supply.
—Current status of the power supply.
Fans
The table displays the following details:
—Name of the fan.
—Current status of the fan.
CPU
The section displays the current CPU utilization percentage and trend chart for the duration specified in the time range filter. Hover your mouse over the trend chart to view the CPU utilization at a particular time.
Memory
The section displays the current memory utilization percentage and trend chart for the duration specified in the time range filter. Hover your mouse over the trend chart to view the memory utilization at a particular time.
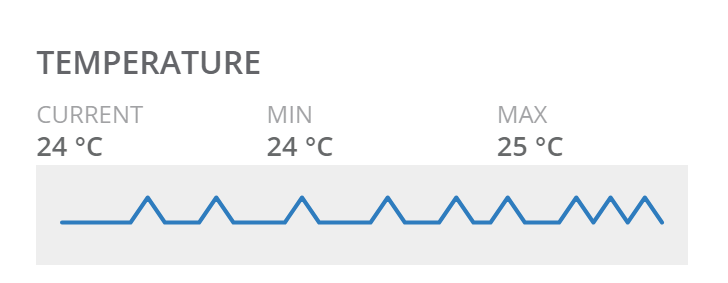
Temperature
|
|
This section is not available for Aruba CX switches. |
The section displays the current, minimum, and maximum temperature and trend chart for the duration specified in the time range filter. Hover over the trend chart to view the temperature at a particular time.
Figure 3 Temperature
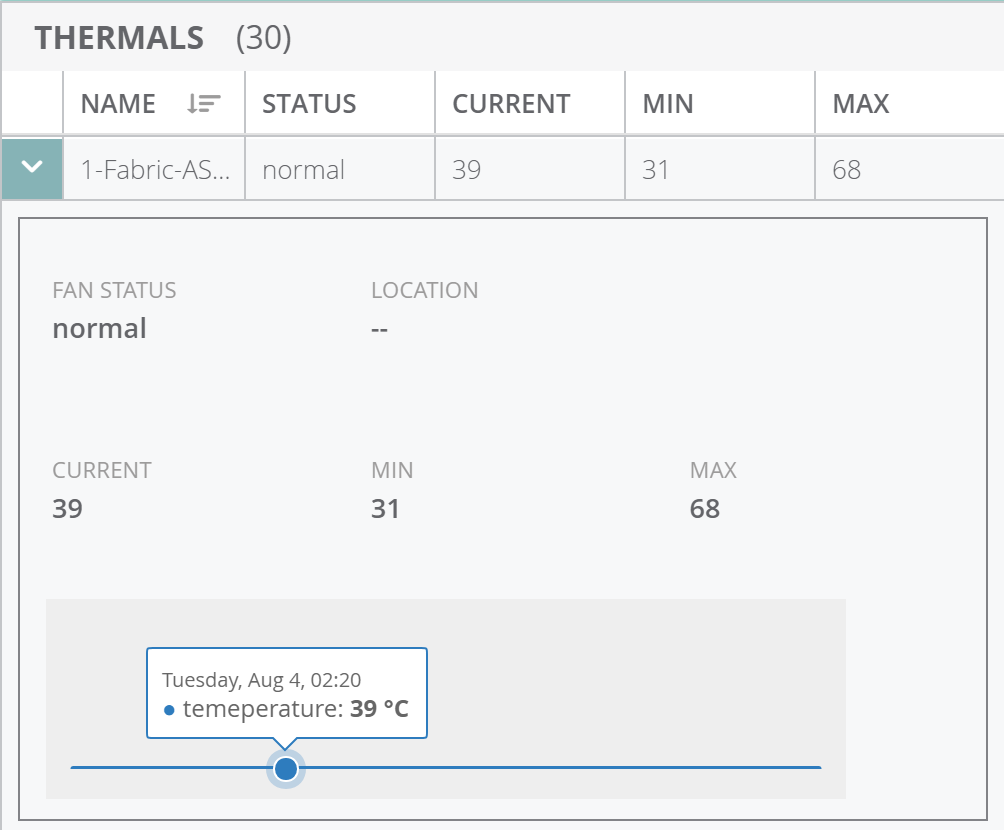
Thermals
|
|
This section is available only for Aruba CX switches. |
The table displays the following details of each of the sensors that are present in the Aruba CX switches:
—Name of the component where the sensor is present.
—Current status of the fan.
—Current temperature of the component.
—Minimum temperature of the component.
—Maximum temperature of the component.
Expand each of the rows to display the fan status, location of the fan, current, minimum, and maximum temperatures, and a temperature trend chart. Hover over the trend chart to view the temperature at a particular time.
Figure 4 Thermals
Actions
The tab displays the various options available for remote administration of the switch. The following options are available:
—Reboots the switch. See Monitoring Switches and Switch Stacks.
—Allows the administrators to generate a tech support dump for troubleshooting the device. See Monitoring Switches and Switch Stacks.
—Opens the remote console for a CLI session through SSH. Ensure that you allow SSH over port 443. The default user ID is admin, but you can edit and customize the user ID. This custom user ID must be mapped to the device. See Monitoring Switches and Switch Stacks.
|
|
For Aruba CX 8320 and 8325 switch series, you must enable SSH server on the default VRF. Add the ssh server vrf default code to the template. If the Copy and Paste function from the keyboard shortcut keys (CTRL+C and CTRL+V) do not work in your web browser, use the Copy and Paste functions available under the menu options in the web browser. |
