
Access Point > Overview > Summary
In the AP dashboard, the tab displays the device details, network information, radio details including the topology of clients connected to each radio, and the health status of the AP in the network. The tab displays the following sections:
Viewing the Overview > Summary Tab
To navigate to the tab in the AP dashboard, complete the following steps:
1. In the app, set the filter to one of the options under , , or . For all devices, set the filter to . Ensure that the filter selected contains at least one active access point.
The dashboard context for the selected filter is displayed.
2. Under , click > .
A list of access points is displayed in the view.
3. Click an access point listed under .
The tab is displayed.
To exit the AP dashboard, click the back arrow on the filter.
You can change the time range for the tab by clicking the time range filter and selecting one of the available options: , , , , and .
Device
The section displays the following details:
—The AP hardware model.
—Country code in which the AP operates.
—MACMedia Access Control. A MAC address is a unique identifier assigned to network interfaces for communications on a network. address of the AP.
—Serial number of the AP.
—Time since when the AP is operational.
—The reason for the latest rebooting of AP.
—The firmware version running on the AP. If the device is running an older firmware version, this field prompts the user to upgrade to the latest firmware version along with the link to the > page.
—Displays the configuration status and the timestamp of the last device configuration changes.
—Displays the operating bandBand refers to a specified range of frequencies of electromagnetic radiation. of the AP. The supported bands are , , or .
—The power utilized by the device in watts (W) or kilowatts (kW).
—The power in watts (W) negotiated on the ethernet port of the device in a wired network.
—The recommended power in watts (W) negotiated on the ethernet port of the device in a wired network.
—The name of the controller.
—The name of the secondary controller.
—The group to which the AP belongs. Click the group name to go to the > page for that group.
|
|
When an AP belongs to an unprovisioned group, the hyperlink to the unprovisioned group is disabled. |
—The labels associated with the AP. You can also add a new label to the AP by clicking the edit icon. To view all the labels associated with a device, hover your mouse over the column.
—To enable the blinking of LEDs on the AP to identify the location. The default blinking time is set to 5 minutes and it automatically stops. To stop the blink, click .
—The site to which the AP belongs. Click the site name to go to the > page for that site.
—When you click the  edit icon, a text-box is displayed. It allows you to add information that can be used as reference. For example, AP location, and upgrade information.
Network
The section displays information of the network and interfaces to which the AP is connected. Along with the network profile name, the following fields are displayed in the section:
—Displays the status of the ETH0 network.
—The speed of the network measured in MbpsMegabits per second. This field also indicates whether the network has a full-duplex or half-duplex communication.
—The number of VLANVirtual Local Area Network. In computer networking, a single Layer 2 network may be partitioned to create multiple distinct broadcast domains, which are mutually isolated so that packets can only pass between them through one or more routers; such a domain is referred to as a Virtual Local Area Network, Virtual LAN, or VLAN. connections associated with the network.
—Click the link to view the ETH0 LLDPLink Layer Discovery Protocol. LLDP is a vendor-neutral link layer protocol in the Internet Protocol suite used by network devices for advertising their identity, capabilities, and neighbors on an IEEE 802 local area network, which is principally a wired Ethernet. details. The pop-up window displays the , , , and details.
—Displays the status of the ETH1 network.
—The speed of the network measured in Mbps. This field also indicates whether the network has a full-duplex or half-duplex communication.
—The number of VLAN connections associated with the network.
—Click the link to view the ETH1 LLDP details. The pop-up window displays the , , , and details.
—The current uplink connection on the AP.
—The switch name to which the AP is connected. Click this link to view the switch details page, if the switch is managed by Aruba Central.
—The port number of the switch to which the AP is connected.
—IP address of the AP.
—IP address logged by servers when the AP device is connected through internet connection.
—The server that has a directory of domain names and their associated IP addresses.
—A 32 bit value that is used to uniquely identify the device on a public network.
—Displays information about the NTPNetwork Time Protocol. NTP is a protocol for synchronizing the clocks of computers over a network. Server.
Radios
The section displays the following information related to , , and :
—The type of mode for the radios. For example, Client Access, Monitor, and Spectrum.
—Displays the operational status of the radios connected to the AP. The status is as follows:
 —Indicates that the radio is online.
 —Indicates that the radio is offline.
—Indicates that the radio is offline as the AP is operating under thermal management. For more information, see Thermal Shutdown Support in Instant AP.
—The MAC address of the radios connected to the AP.
—The channels assigned to the radios.
—The transmit power of the radios.
—The type of wireless LANLocal Area Network. A LAN is a network of connected devices within a distinct geographic area such as an office or a commercial establishment and share a common communications line or wireless link to a server. used for the radios.
—The number of clients connected to the AP.
—The number of SSIDsService Set Identifier. SSID is a name given to a WLAN and is used by the client to access a WLAN network. configured in the network.
—The type of antennae. For example, internal and external.
—Displays the number of spatial streams. By default, the spatial stream value for is 8x8. When tri-radio mode is enabled, the spatial stream values for and is 4x4.
|
|
When the Instant AP radios are set to spectrum scan mode, the and values are empty. |
|
The tri-radio feature is available only for AP-555. In the section, the data is available only if the tri-radio mode is enabled. For more information, see Tri-Radio Mode. |
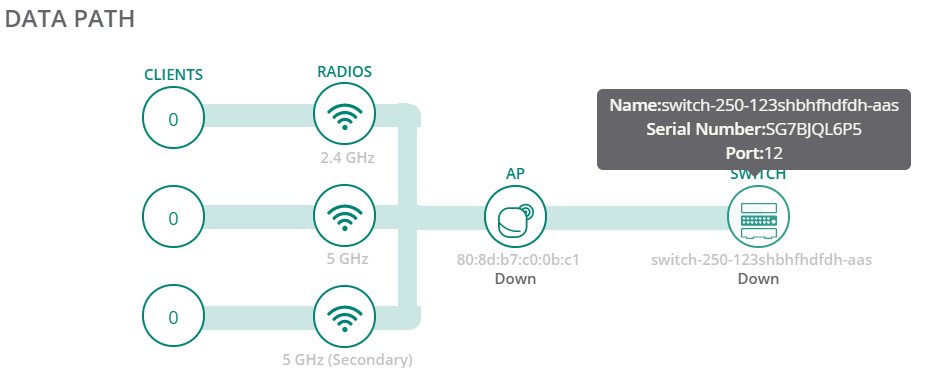
Data Path
The section displays the topology of clients connected to each of the radios of the AP, which in turn is connected to switches or controllers through VLAN. When you hover over the upstream device in the data path topology, a pop-up displays the , , and details of the upstream devices.
Figure 1 Data Path
|
|
The tri-radio feature is available only for AP-555. In the section, the data is available only if the tri-radio mode is enabled. For more information, see Tri-Radio Mode. |
Health Status
The trend graph indicates the health status of the device in the network for the time specified in the time range filter. When you over the graph, you can view information such as date and time, , , , , , , and .
|
|
The tri-radio feature is available only for AP-555. In the section, the data is available only if the tri-radio mode is enabled. For more information, see Tri-Radio Mode. |
Actions
The drop-down list contains the following options:
—Reboots the access point. For more information, see Rebooting an Instant AP.
—Reboots the AP cluster. For more information, see Rebooting an Instant AP Cluster .
—Enables the administrator to generate a tech support dump required for troubleshooting the access point. For more information, see Tech Support for an Instant AP .
—Opens the remote console for a CLI session through SSHSecure Shell. SSH is a network protocol that provides secure access to a remote device. for an access point. For more information, see Opening a Remote Console.
Go Live
Aruba Central supports live monitoring of Instant APs that support Aruba Instant 8.4.0.0 firmware version and above. Aruba Central allows you to monitor live data of an AP updated at every 5 seconds. For more information, see Enabling Live Instant AP Monitoring.
