
What's New
The following features and enhancements are now available in Aruba Central (on-premises):
Aruba AI Insights delivers actionable guidance for improving network performance and the quality of your users’ mobile experience via continuous monitoring, analysis, and benchmarking. Using powerful machine learning algorithms and Aruba’s extensive wireless expertise, AI Insights arms IT organizations with the intelligence needed to proactively optimize how data, voice, and video applications perform across your entire campus – including local and remote locations. AI Insights support the following features in Aruba Central (on-premises) deployment:
Wi-Fi Connectivity Dashboard - The page displays an overall view of the connection details for all clients that are connected to or tried to connect to each connection phase.
WLAN Connectivity Insights - Insights can be accessed from different contexts such as , , , and . Aruba Central's built-in AI Insights proactively identifies issues and provides configuration recommendations. In this release, the AI Insights dashboard has been reorganized for better user experience. Insights are now classified under three categories, Connectivity, Wireless Quality, and Availability. The following four types of connectivity Insights are supported in Aruba Central (on-premises):
Clients had excessive Wi-Fi security key-exchange failures
Clients had excessive 802.1x authentication failures
Clients had DHCP server connection problems
Clients had an unusual number of MAC authentication failures
WLAN Connectivity Alerts - Aruba Central (on-premises) allows you to configure and enable connectivity alerts to generate and display alerts when DNSDomain Name System. A DNS server functions as a phone book for the intranet and Internet users. It converts human-readable computer host names into IP addresses and IP addresses into host names. It stores several records for a domain name such as an address 'A' record, name server (NS), and mail exchanger (MX) records. The Address 'A' record is the most important record that is stored in a DNS server, because it provides the required IP address for a network peripheral or element. delays, DHCPDynamic Host Configuration Protocol. A network protocol that enables a server to automatically assign an IP address to an IP-enabled device from a defined range of numbers configured for a given network. delays, authentication delays, and association failures are detected.
Failed Wireless Client Events or Reasons - AI Insights helps populate the last seen time stamp, failure stage, and failure reason for a failed client. This information is communicated to the Aruba Central (On-premises) server and is displayed in the Failed clients list in . Also, if an AI insight is associated with a failed client, the AI insight number is listed in the table and can be used to open the insight and troubleshoot the client issues.
For more information, see the following topics:
Aruba Central now supports configuration of Aruba CX switches and CX switch stack by using templates only. For more information, see the following topics:
Supported Aruba CX Switch Platforms
Getting Started with Aruba CX Deployments
Aruba Central now supports monitoring of Aruba CX switches.
—The new VSX page shows details about VSX configuration between two Aruba CX switches. It also shows details about the status of the inter-switch link (ISL) and the configuration synchronization between the switches.
For more information, see Viewing the VSX Page.
The following existing pages in Aruba Central have been enhanced to show details about Aruba CX switches:
—The Switches tab displays the list of Aruba CX switches provisioned and managed in Aruba Central.
For more information, see Viewing the Switches List Page.
—The Summary view in the Switches tab provides a graphical view of all metrics about the usage and client information of Aruba CX switches.
For more information, see Viewing the Switches Summary Page.
—The Summary tab displays the Aruba CX switch device details, network details, hardware, and details about the stack members.
For more information, see Viewing the Overview > Summary Tab.
—The Hardware tab displays information related to Aruba CX switch power supplies, fans, utilization, and temperature.
For more information, see Viewing the Overview > Hardware Tab.
—The Clients tab displays information about the wired clients that are connected to the Aruba CX switch.
For more information, see Viewing the Clients > Clients Tab.
—The Neighbours tab displays information about the devices neighboring the Aruba CX switch.
For more information, see Viewing the Clients > Neighbours Tab.
—The Ports tab displays details about ports and the LAGs configured on the Aruba CX switch.
For more information, see Viewing the LAN > Ports Tab.
—The PoEPower over Ethernet. PoE is a technology for wired Ethernet LANs to carry electric power required for the device in the data cables. The IEEE 802.3af PoE standard provides up to 15.4 W of power on each port. tab displays information, such as, PoE status summary, PoE ports, and PoE consumption for supported Aruba CX switches.
For more information, see Viewing the LAN > PoE Tab.
—The VLANVirtual Local Area Network. In computer networking, a single Layer 2 network may be partitioned to create multiple distinct broadcast domains, which are mutually isolated so that packets can only pass between them through one or more routers; such a domain is referred to as a Virtual Local Area Network, Virtual LAN, or VLAN. tab displays the VLAN information configured on Aruba CX switches. It also displays details about tagged and untagged ports.
For more information, see Viewing the LAN > VLAN Tab.
—The Topology map now shows Aruba CX switches and displays the details.
For more information, see Monitoring Sites in the Topology Tab.
The Health Bar provides a snapshot of the overall health of the devices configured and clients. In the selected filter, click the Health Bar icon to expand the Health Bar. Use the pin icon to pin the Health Bar. After you pin the Health Bar, the Health Bar is displayed in the following dashboards:
Global dashboard
Group dashboard
Site dashboard
Access Point dashboard
Switch dashboard
Controller dashboard
Wireless client dashboard
Wired client dashboard
Both icons are displayed in the following image:
Figure 1 Expanded but Unpinned Health Bar in the Global Dashboard
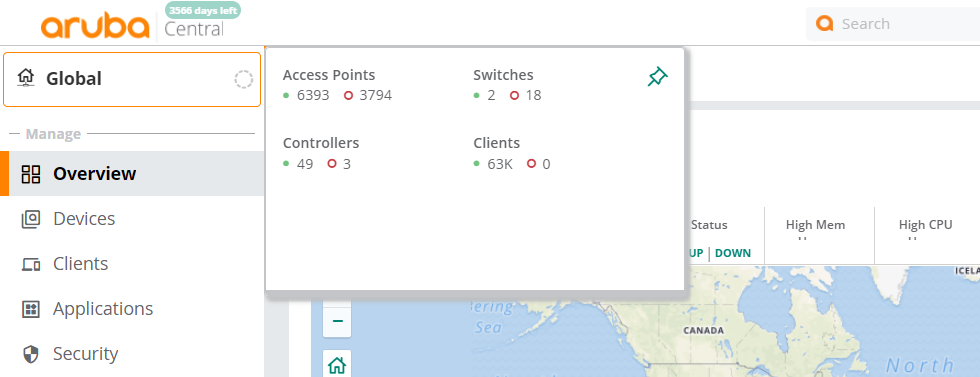
The following table includes information on the various parameters of the Health Bar:
|
Parameter |
Dashboard |
Description |
|---|---|---|
|
|
Global |
Displays the number of access points that are online and the number of access points that are offline. Clicking the number in green redirects you to > > inview. Clicking the number in red redirects you to > > inview. |
|
|
Global |
Displays the number of switches that are online and the number of switches that are offline. Clicking the number in green redirects you to > > inview. Clicking the number in red redirects you to > > inview. |
|
|
Global |
Displays the number of controllers that are online and the number of controllers that are offline. Clicking the number in green redirects you to > > inview. Clicking the number in red redirects you to > > inview. |
|
|
Global |
Displays the number of clients that are connected and the number of clients that failed to connect. Clicking the number in green or red redirects you to > > inview. |
For more information, see The Health Bar.
System management tab allows you to perform administrative tasks such as setting up the system, enabling SMTPSimple Mail Transfer Protocol. SMTP is an Internet standard protocol for electronic mail transmission. settings, notifications, migration, and even backup and restore. The includes the following tabs:
—This tab displays the following system performance details:
The overall status of all the appliances, Central Processing Units, memory units, data storage units.
The percentage of CPUCentral Processing Unit. A CPU is an electronic circuitry in a computer for processing instructions. and memory utilization, status of the appliances in the cluster, percentage of disk space usage.
The status of various deployments, the number of restarts undergone by the services, and the age of the services.
The various log files that are related to the appliances and services.
The details of various system operations running across the cluster.
For more information, see Viewing Central System Status.
—The tab displays the following details:
The version pane allows you to view Installed and Available Version Information
The upgrade pane allows you to upgrade Aruba Central (on-premises) to the latest version
The generate logs pane generates the log files related to events that occurred during an upgrade.
For more information, see Version.
—This tab displays the following details:
A network pane that allows you to view the system information that are based on the data configured during network setup.
A Proxy pane that allows you to configure and validate a Proxy server.
A Support connection button that allows you to activate or stop a connection between the tunnels.
For more information, see Network.
This tab displays the following details:
A table of SMTP servers, the ports used by the servers, and the server status.
The trap destination IP addresses of the SNMPSimple Network Management Protocol. SNMP is a TCP/IP standard protocol for managing devices on IP networks. Devices that typically support SNMP include routers, switches, servers, workstations, printers, modem racks, and more. It is used mostly in network management systems to monitor network-attached devices for conditions that warrant administrative attention. server where the trap is sent, and the SNMP server versions.
A list of syslog servers with the corresponding IP addresses and the associated ports.
For more information, see SMTP .
—In this release, the tab under has been reorganized and enhanced for better user experience. The page now includes the following enhanced sections:
—Allows you to manually backup or schedule a backup of system information, group configuration data, and historical reports. You can also view the status of the supported data types by clicking the Backed up Systems arrow. The status sign against each data type turns green representing a successful backup and red representing a failed backup.
—Allows you to perform a restore operation of the backed up data. You can also view the progress of the restore operation by logging into Aruba Central CLI through a serial console and use the show command to navigate to Backup-Restore status.
—Allows you to view and download logs related to the events that occurred during the backup and restore process.
For more information, see Backing up and Restoring Aruba Central System Data
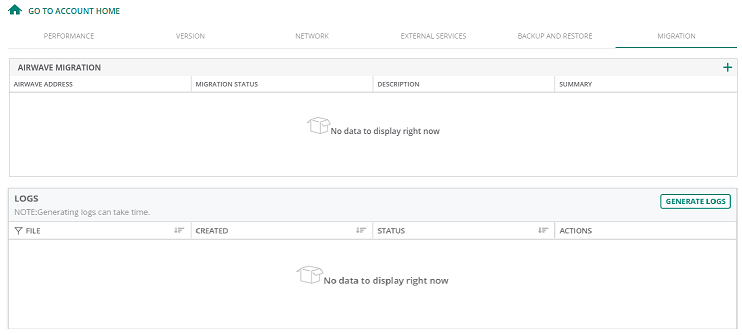
—This tab displays all the details related to the AirWave 8.x to Aruba Central (on-premises) migration tasks. To access the migration page, perform the following procedure:
1. Log in to your Aruba Central (on-premises) account as an administrator.
2. Click the page icon.
The Account Home page is displayed.
3. Click >
4. Click the tab.
The migration page is displayed.
|
|
During the migration process, a new AMPAirWave Management Platform. AMP is a network management system for configuring, monitoring, and upgrading wired and wireless devices on your network. back up is created in AirWave and transferred to the Aruba Central (on-premises). The scheduled nightly backup is independent of the backup operation performed as a part of the migration process. |
For more information, see Aruba Central (on-premises) Migration Guide.
The following are the navigation updates for the app:
Using the Filter in the Network Operations App
In the app, you can use the filter to select to access the all devices dashboard.
Figure 2 Filter in the Network Operations App

You can also use the filter to type in the name for a group, label, or site, and then click on any of the available options to display the resultant dashboard. Hovering over the filter value in the resultant dashboard displays a pop-up indicating whether the dashboard is for a group, label, site, client, or a device such as a switch, AP, or controller.
Some of the left-navigation menu items and their related pages for these dashboards are now re-organized for better user experience. The following table lists the different kinds of dashboards, click each dashboard type to know more about the navigational changes.
Table 1: Types of Dashboards
|
Link to the Dashboard |
Filter Value and Dashboard Description |
|---|---|
|
When the filter is set to (for standard enterprise modes) or (for managed service modes), the dashboard context displayed is for all available devices registered to the specific Aruba Central account. This is called the global dashboard. |
|
|
When the filter is set to a specific group, the dashboard context displayed is only for the devices that are configured as part of that group. This is called the group dashboard. |
|
|
When the filter is set to a specific site, the dashboard context displayed is only for the devices that are configured as part of that site. This is called the site dashboard. |
|
|
When the filter is set to a specific label, the dashboard context displayed is only for the devices that are configured as part of that label. This is called the label dashboard. |
|
|
When the filter is set to a controller, the dashboard context displayed is only for the that specific controller. This is called the controller dashboard. Thecontroller dashboard enables you to manage and monitor a specific controller. |
|
|
When the filter is set to an access point, the dashboard context displayed is only for the that specific access point. This is called the access point dashboard. The access point dashboard enables you to manage and monitor a specific access point. |
|
|
When the filter is set to a switch, the dashboard context displayed is only for the that specific switch. This is called the switch dashboard. The switch dashboard enables you to manage and monitor a specific switch. |
|
|
In the app, the client dashboard is displayed under > for any filter value. |
In the app, the steps to navigate to a device dashboard for a switch, AP, or controller are now updated. Complete the following steps to access a device dashboard:
1. In the app, set the filter to one of the options under , , or . For all devices, set the filter to .
The dashboard context for the selected filter is displayed.
2. Under > , select one of the following options:
To view an AP dashboard, click the tab.
To view a switch dashboard, click the tab.
To view a controller dashboard, click the tab.
The list of devices is displayed in view.
3. Click a device listed under .
The dashboard context for the specific device is displayed.
To exit the device dashboard, click the back arrow on the filter.
Clicking the back arrow takes you to the global dashboard.
This release introduces the following enhancements to the dashboard. Hover over a site to view the following details:
—Displays the overall end-user experience. This field is displayed if there is at least one Cape sensor deployed in the site. To enable this feature, you must purchase a license. Contact your Aruba sales specialist for additional information. The following APIApplication Programming Interface. Refers to a set of functions, procedures, protocols, and tools that enable users to build application software. is introduced in the > category to enable this feature:
—Allows you to navigate to the > dashboard.
—Displays the number of connected and failed clients.
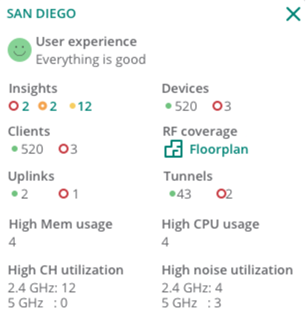
For more information, see Network Health.
To view the Controller dashboard, complete the following steps:
1. In the app, set the filter to .
2. Click .
Controllers Dashboard
The dashboard page displays a complete list of offline or online controllers provisioned in Aruba Central. You can also use the following filtering options to view a specific set of controllers.
—Displays controller clusters deployed in Aruba Central. A controller cluster includes multiple controllers working together as a single managed entity. Controller clusters enable seamless roaming of clients between AP and ensure service continuity in the event of a failover. Controller clustering is supported only on devices running ArubaOS 8.x or later software versions. To view the cluster components, expand the cluster in the column.
—Displays a complete list of controllers.
—Displays a list of controllers that are functioning as Mobility Masters. The ArubaMobility Master is an advanced master controller deployed as a virtual machine (VMVirtual Machine. A VM is an emulation of a computer system. VMs are based on computer architectures and provide functionality of a physical computer.) or installed on an x86-based hardware appliance. A single Mobility Master or a cluster of Mobility Masters oversees co-located controllers. It also displays the details about the APs associated with each controller.
For more information, see The Controller Dashboard.
Aruba Central now supports the following configuration related changes on access points:
Aruba Central now supports RADIUSRemote Authentication Dial-In User Service. An Industry-standard network access protocol for remote authentication. It allows authentication, authorization, and accounting of remote users who want to access network resources. over TLSTransport Layer Security. TLS is a cryptographic protocol that provides communication security over the Internet. TLS encrypts the segments of network connections above the Transport Layer by using asymmetric cryptography for key exchange, symmetric encryption for privacy, and message authentication codes for message integrity. , also known as RadSec, which provides end-to-end secure communication between the RADIUS server and Instant AP and increases the level of security for authentication that is carried out across the cloud network. Navigate to the configuration dashboard, and click the tab. Click under to open the page. From the drop-down list, select to configure the field.
For more information, see the following topics:
Configuring Authentication and Security Profiles on Instant APs
Aruba Central now supports RADIUS over TLS, also known as RadSec, which provides end-to-end secure communication between the RADIUS server and Instant AP and increases the level of security for authentication that is carried out across the cloud network. Navigate to the configuration dashboard, and click the tab. Click under to open the page. From the drop-down list, select to configure the field.
For more information, see the following topics:
Configuring Authentication and Security Profiles on Instant APs
Navigate to the dashboard, and click the tab. Under > , expand to view the following changes:
A field is included that enables the Client Match feature to work across different standalone Instant APs in the same management VLAN. All such standalone Instant APs are set with the same Client Match key that synchronizes information exchanged between the Instant APs.
The following fields are introduced to avoid random change of channels in 2.4 GHzGigahertz. bandBand refers to a specified range of frequencies of electromagnetic radiation.:
For more information, see Configuring ARM and RF Parameters on APs.
Aruba Central now constantly displays the default tabs under the and option in the > page. When you click the or option and navigate out of the page, the respective default tabs under or option are still displayed when you visit the page next time.
For more information, see Configuring Access Points.
Aruba Central now supports up to 128 ASCIIAmerican Standard Code for Information Interchange. An ASCII code is a numerical representation of a character or an action. or non-ASCII characters for the AP name. Navigate to the > > page and select the tab. In the table, configure the AP name in the column.
For more information, see Configuring Device Parameters .
Aruba Central now allows you to directly edit the Wireless SSIDService Set Identifier. SSID is a name given to a WLAN and is used by the client to access a WLAN network. name. Navigate to the > > page. In the table under tab, edit the relevant SSID that you want to rename under the column,
For more information, see the following topics:
Aruba Central now allows you to directly edit the Wireless SSID name. Navigate to the > > page. In the table under tab, edit the relevant SSID that you want to rename under the column,
For more information, see the following topics:
Aruba Central introduces feature that allows you to configure wired servers with its IP address or MACMedia Access Control. A MAC address is a unique identifier assigned to network interfaces for communications on a network. address. It is a global whitelist for all WLANWireless Local Area Network. WLAN is a 802.11 standards-based LAN that the users access through a wireless connection. SSIDs and wired networks where trusted servers are added using their IP or MAC address. Navigate to the configuration dashboard, and click the tab. Expand the accordion to configure the feature.
For more information, see the following topics:
Configuring a Wired Server with the IP Address
Configuring Authentication and Security Profiles on Instant APs
Aruba Central now allows you to configure in WLAN network profiles. It allows the user to configure 24 PSKs per SSID locally on the device. These local PSKs would serve as an extension of the base MPSK functionality. Navigate to the configuration dashboard, and click the tab. Expand the accordion to configure the feature.
For more information, see the following topics:
Configuring a MPSK Local Profile
Configuring Authentication and Security Profiles on Instant APs
Following are the access point monitoring enhancements:
AP-555 supports tri-radio mode. By default, the AP-555 operates in dual radio mode. When the tri-radio mode is enabled, the 8x8 5 GHz radio is split into two independent 4x4 5 GHz radios. In the tri-radio mode, the secondary 5 GHz radio operates on channels from 36 to 64 and the 5 GHz radio operates on channels from 100 to 165. To enable tri-radio, go to > and select the check-box.
For more information, see Tri-Radio Mode.
AP-535 and AP-555 support thermal shutdown. These access points are equipped with an internal thermal sensor. The sensor initiates a shutdown when the operating temperature crosses the temperature threshold recommended for an access point.
For more information, see Thermal Shutdown Support in Instant AP.
The > page has been enhanced to include the following options:
Aruba Central now supports rebooting access point(s) from the table.
For more information, see Rebooting an AP.
The following columns are added in the table:
—Displays the operational status of the access point.
—Displays the name of the LLDPLink Layer Discovery Protocol. LLDP is a vendor-neutral link layer protocol in the Internet Protocol suite used by network devices for advertising their identity, capabilities, and neighbors on an IEEE 802 local area network, which is principally a wired Ethernet. neighbor. Click the name to view the switch details page.
—Displays the port number of the LLDP neighbor.
—Displays the number of AI insights generated for the access point.
—Displays the name of the zone to which the access point belongs.
—Displays the information captured in the > > field.
For more information, see Monitoring Access Points in List View.
In the page, the tabs and options in the left navigation menu have been reorganized for better user experience. For more information, see The Access Point Dashboard.
The access point dashboard has the following UI parameters introduced as part of the > > page:
section
—Displays the operating band of the AP. The supported bands are , , and .
—Allows you to add information that can be used as reference. For example, AP location and upgrade information.
—The name of the group, if the AP is configured as part of a group. Click the group name to go to the > page for that group.
—The name of the site, if the AP is configured as part of a site. Click the site name to go to the > page for that site.
—Label name(s). An access point can be assigned a single or multiple labels.
section
—Displays the type of antenna. For example, internal or external.
—Displays the number of spatial streams. For example, 4x4 or 8x8.
section
Displays the data path topology. Hover over the upstream device to view the , , and details of the upstream device.
For more information, see Access Point > Overview > Summary.
Following are the switch configuration and monitoring enhancements:
—Administrators can now configure port-based tunnel on switches from the page. This allows switch to tunnel traffic on a per-port basis.
For more information, see Configuring Switches in UI Groups.
—Switch configuration is now automatically rolled back to the last known stable configuration when switch loses connectivity to Aruba Central.
For more information, see Configuring Switches in UI Groups.
—Administrators can now assign a VLAN as Primary VLAN and Management VLAN when configuring VLANs.
For more information, see Configuring VLANs on Aruba Switches.
—Administrators can now enable and configure 802.1X802.1X is an IEEE standard for port-based network access control designed to enhance 802.11 WLAN security. 802.1X provides an authentication framework that allows a user to be authenticated by a central authority. authentication and MAC authentication for switches at port level.
For more information, see 802.1X Authentication.
—Administrators can now configure RADIUS (Remote Authentication Dial-In User Service) server settings on switches.
For more information, see Editing a RADIUS Server Settings.
—Aruba Central now supports one member BPS stack in UI group. A one member BPS switch stack can be added to Aruba Central and managed through UI group.
For more information, see Onboarding commander and members to Aruba Central
—Administrators can now configure DHCP snoopingDHCP snooping enables the switch to monitor and control DHCP messages received from untrusted devices that are connected to the switch. setting from page.
For more information, see Configuring Trunk Groups on Aruba Switches in UI Groups.
—Administrators can now use Network Time Protocol (NTPNetwork Time Protocol. NTP is a protocol for synchronizing the clocks of computers over a network.) as a Time Synchronization method.
For more information, see Predefined DST Rules.
—Administrators can now configure following QoSQuality of Service. It refers to the capability of a network to provide better service and performance to a specific network traffic over various technologies. settings on switches:
Creating QoS traffic policies.
Defining QoS classes for a QoS Policy.
Changing the priorities of traffic.
For more information, see Creating a QoS Traffic Policy.
—Administrators can now configure a device profile. This allows administrators to dynamically detect an AP, which is directly connected to the switch, and apply predefined configurations to ports on which the AP is detected.
For more information, see Configuring Switches in UI Groups.
The switch dashboard has the following UI parameters introduced as part of the page:
—The name of the group, if the switch is configured as part of a group. Click the group name to go to the page for that group.
—The name of the site, if the switch is configured as part of a site. Click the site name to go to the page for that site.
—Label name(s). A switch can be assigned a single or multiple labels.
For more information, see Viewing the Overview > Summary Tab.
This release introduces the following enhancements to the > tab:
New options:
Show Labels
Filter
Left-Right Orientation
Top-Down Orientation
Search Bar
Reset
Hover over the device, tunnel, link, or edge to view the , link, and parameters. The and details of the devices are also displayed.
The map now displays Aruba CX switches and displays the details.
In the map, a bubble icon on the device represents the number of connected downstream devices. When the number of downstream devices connected to a device is less than or equal to 10, the devices are visible in the topology map. When the number of downstream devices connected to a device is more than 10, click the device icon to view the devices in the topology map.
The map now displays tunnels as dotted lines. The red and green color of the tunnel lines indicates the health of the tunnel link.
For more information, see Monitoring Sites in the Topology Tab.
Following are the new features and enhancements:
The table under > provides a detailed list of advanced filters. The following new columns have been introduced: , , , , and . The page also allows you to filter the client list based on type of network the client is connected to or the connectivity status.
To filter clients based on the network to which the clients are connected, click the network type from the bar:
—Displays a list of all the clients connected to the network.
—Displays a list of clients connected to the wireless network.
—Displays a list of clients connected to the wired network.
To filter the clients based on the state of connectivity, click the connectivity type from the bar:
—Displays a list of clients that are successfully connected to the network.
—Displays a list of all failed client connections.
—Displays a list of all offline clients.
—Displays a list of all blocked clients.
For more information, see All Clients.
The page provides the details of the client datapath, client, network, and connection details, along with the graphical representation of , , , , , and of each wireless client.
For more information, see Client Details.
Following are the new features and enhancements:
report—Aruba Central now allows you to create reports. report displays the device growth over two years for wireless and wired clients, and the wireless and wired usage over time. The report includes details of usage, clients per day, usage over time, and top clients.
report—The report now provides the details of , compliance result as or with the number of violations, and PCI report version 3.2 for Instant APs.
andreports—You can now set a role based or SSID based filter for a report or a report for all groups, multiple groups, or a single group.
For more information, see Reports
The following enhancements are introduced in the page:
—Select a site and navigate to the page. In the context, you can suppress alert notifications to prevent devices that are part of the site from generating alert notifications.
—You can add email address(es) as default recipients to receive alert notification.
The following new options are added under :
option is added for few alerts
option is added for port alerts
has been renamed to and the following new alerts have been added under this category:
COP Service Status
Infra CPU Usage
Infra Memory Usage
Infra Disk Usage
Infra Load Average
Node Not Ready
Radio Frames Retry Percent
IAP Firmware Upgrade Failed
Switch STPSpanning Tree Protocol. STP is a network protocol that builds a logical loop-free topology for Ethernet networks. Root Change
Stack Member Added/Removed
Switch Stack Commander Change
For more information, see the following topics:
Aruba Central’s VisualRF feature allows you to plan sites, create and manage floor plans, and provision access points. VisualRF provides a real-time picture of the radio environment of your wireless network and the ability to plan the wireless coverage of new sites.
From this release onwards, the dashboard can be accessed from a site context, or for a specific AP.
To view the dashboard from a site context, complete the following steps:
1. In the app, set the filter to a site.
The dashboard context for the selected site is displayed.
2. Under > , click . The dashboard is displayed.
The dashboard allows you to customize the view by selecting various properties and also allows you to select multiple floors in the same site.
The dashboard now provides the following options to customize your view:
—Click the drop-down to select a specific floor from the site.
—Click to view the details of the Instant AP and the RFRadio Frequency. RF refers to the electromagnetic wave frequencies within a range of 3 kHz to 300 GHz, including the frequencies used for communications or Radar signals. environment.
—Click to view the client details.
—Click to view the strength of RF coverage in each location. You can view heatmaps in monochrome also. Click the monochrome checkbox in the dashboard to select either the monochrome display or the colored display of heatmaps.
—Click to view the segregation of regions and walls in the selected floor.
—Click the or icon to zoom in or zoom out of a floorplan. You can also scroll to increase or decrease the floorplan view. Additionally, click the box icon to view the floorplan in full screen mode.
—Click the refresh icon to refresh the floorplan details.
For more information, see the following topics:
The > page has been reorganized for better user experience. The page now includes the following tabs:
In previous releases, the page displayed all these details in the same page.
For more information, see Application Visibility.
Aruba Central now supports client match. Client match identifies the wireless clients that are not getting the required level of service from the AP to which they are currently associated and intelligently steers them to an AP radio that can provide better service and thereby improves user experience.
For more information, see Client Match.
Aruba Central now supports SIPSession Initiation Protocol. SIP is used for signaling and controlling multimedia communication session such as voice and video calls. protocol and allows enabling or disabling the Unified Communications service.
For more information, see Enabling Unified Communications.
This release introduces the following new API to resolve discrepancies in the policy compliance data displayed at the Site level and the device level:
The following enhancements are introduced in the page:
The option is renamed as .
The option is renamed as and is now available as a column in the table.
The option is now available at the top right.
In the table, hover over a device and click the icon in the column to upgrade the device or select multiple devices and click the icon that appears as a pop-up to upgrade the selected devices.
—For access points, you can perform a standard upgrade or live upgrade. Live upgrade enables you to upgrade the firmware without affecting the network.
—Allows you to search and filter the devices in the table.
The column in the tab displays the switch family. The switch family type can be or .
tab is displayed only if MAS switches are in use and managed by Aruba Central.
For more information, see Upgrading Device Firmware.
This release introduces the following enhancements:
—You can now select the option that allows automatic retry of a request upon encountering a specific error. Select one of the following options:
—No retries.
—Up to 5 retries over 6 minutes.
—Up to 5 retries over 27 hours.
In the table, hover over a Webhook to view the following icons in the column:
Click the icon to test the webhook by posting sample webhook payload to the configured URLUniform Resource Locator. URL is a global address used for locating web resources on the Internet.. The following details are displayed in a pop-up window: and .
Click theicon to view the logs. The following details are displayed in a pop-up window: , , and .
For more information, see Aruba Central (on-premises) API Reference Guide.
This release introduces the following CLI commands:
—You can upload a file to the host over SCPSecure Copy Protocol. SCP is a network protocol that supports file transfers between hosts on a network..
—You can upload a file to the host over SFTPSecure File Transfer Protocol. SFTP is a network protocol that allows file access, file transfer, and file management functions over a secure connection..
—You can upload a file to the host over HTTPHypertext Transfer Protocol. The HTTP is an application protocol to transfer data over the web. The HTTP protocol defines how messages are formatted and transmitted, and the actions that the w servers and browsers should take in response to various commands. or HTTPSHypertext Transfer Protocol Secure. HTTPS is a variant of the HTTP that adds a layer of security on the data in transit through a secure socket layer or transport layer security protocol connection..
—You can collect log snapshots of specific categories.
—You can collect system operation logs.
—You can collect pod logs.
—You can collect log snapshots for specific nodes.
—You can download upgrade reports.
—You can search the commands, for example, Show or cluster related commands.
For more information, see File Operations, Search Commands, and Log Snapshot Operations.
